RISK MANAGEMENT
2
of 4
Risk management
25.04.2017

Italy - Wind turbines against frost

Just as forecast, frost hit central and northern Italy from Romagna to Piedmont and from Lombardy to Veneto. Temperatures dropped to zero degrees in many areas. A producer from Faenza, Daniele Peroni, reports his positive experience after using a wind turbine. "It covers 2.5 hectares. We monitored the temperature and, when it reached 0°C, we activated the turbine." They are very popular in the Ravenna area. As explained by expert William Pratizzoli, they mix air so that the colder layers at the bottom are combined with warmer air. The temperature in the area near Peroni's kiwi growing companies, dropped below zero, while the area covered by the turbine remained above 1-2°C. The turbine was active between 3 and 6 am, then the temperature increased naturally. "We installed it 30 years ago but we don't need to use it against frost every year. We also use it to favour kiwi pollination. Our model is rather dated and works with a 120 cv diesel motor." Source - www.freshplaza.com

24.04.2017

France - Winegrowers protect the vines from the severe cold (photos)

The cold snap that hit France last week caused Burgundy winegrowers to fear the worst, given the devastating effect of frost on their vines. Under threat was the famous Chablis vineyards, where last year the crop was devastated by unseasonal rain and frost in April, followed by hail in June. After facing a first wave of frost on Tuesday night, Thursday night the winegrowers used several protection systems to protect the vines from the severe cold. Some sprinkling devices were activated from 11pm. But more spectacular by far was the lighting of hundreds of small, oil-burning heaters across hectares of vines to limit the effects of the frost.     Source - www.connexionfrance.com

02.12.2015

USA - SAIC Awarded $156 Million Contract by USDA Risk Management Agency

Science Applications International Corp. (NYSE: SAIC) was awarded a prime task order to provide full life cycle information technology services to the U.S. Department of Agriculture (USDA) Risk Management Agency (RMA). The single-award task order has a one-year period of performance, four one-year options, and a total contract value of $156 million if all options are exercised. Work will be performed in Kansas City, Missouri. The USDA’s RMA operates and manages the Federal Crop Insurance Corporation, which provides crop insurance to American farmers and ranchers. The contract was awarded by the General Services Administration (GSA), Federal Acquisition Service, Assisted Acquisition Services, Federal Systems Integration and Management Center under the GSA Alliant Governmentwide Acquisition Contract. Under the contract, SAIC will provide IT services to support development and delivery of new crop insurance products, sustain high employee productivity, develop and maintain new IT systems, and design, deploy, and maintain the underlying infrastructure for RMA’s IT systems. SAIC will also provide services that support program and project management, enterprise architecture, software development, IT operations and maintenance, and end-user support. "SAIC has supported USDA RMA for more than 15 years and we are proud to continue to deliver these critical IT services to ensure America’s farmers and ranchers obtain the proper support they need,” said Bob Genter, SAIC senior vice president and general manager of the Federal Civilian Customer Group. About SAIC SAIC is a premier technology integrator providing full life cycle services and solutions in the technical, engineering, intelligence, and enterprise information technology markets. SAIC is Redefining Ingenuity through its deep customer and domain knowledge to enable the delivery of systems engineering and integration offerings for large, complex projects. SAIC’s approximately 15,000 employees are driven by integrity and mission focus to serve customers in the U.S. federal government. Headquartered in McLean, Virginia, SAIC has annual revenues of approximately $4.4 billion. For more information, visit saic.com. For ongoing news, please visit our newsroom. Certain statements in this announcement constitute forward-looking statements within the meaning of the Private Securities Litigation Reform Act of 1995. These statements involve risks and uncertainties and a number of factors could cause our actual results, performance, achievements, or industry results to be very different from the results, performance, or achievements expressed or implied by such forward-looking statements. Some of these factors include, but are not limited to, the risk factors set forth in SAIC's Annual Report on Form 10-K and other such filings that SAIC makes with the SEC from time to time, which may be viewed or obtained through the Investor Relations section of our web site at www.saic.com. Due to such uncertainties and risks, readers are cautioned not to place undue reliance on such forward-looking statements, which speak only as of the date hereof. Source - http://www.businesswire.com

04.11.2014

The U.S. Drought Monitor and Its Role in Agricultural Drought Risk Management

A newly-released United Nations report now estimates that the direct losses from natural disasters globally since 2000 are potentially in the $U.S. 2.5 trillion range (UNISDR 2013a).  This statement is important because it is twice the size of any previous estimate, and it illustrates that natural disasters will be significant issues for all societies in the future.  In a corresponding press release, UN Secretary-General Ban Ki-moon argued that the “economic losses from disasters are out of control” and that these losses will continue to “escalate” unless action is taken to reduce disaster risks in the future (UNISDR 2013b). Global Impact and Response to Drought Events In this context, recent droughts around the world have emphasized the very large economic impacts that this natural disaster can cause for societies in both the developed and developing world.  The 2011 drought across the southern Plains of the United States is estimated to have caused economic losses of approximately $US 12 billion, while the overall economic losses from the central United States drought in 2012 are approximately $US 30 billion (NCDC 2013).  These two events, along with the 2010 drought/heat wave event across Russia’s wheat region, demonstrate that droughts can   also create ripple effects around the world because of the interconnectedness of global grain and trade markets. The typical post-event drought responses provided by officials have been found to be both uncoordinated and untimely, and therefore much less effective than they could be (Wilhite and Pulwarty 2005).  Because the prevailing current post-event approaches do nothing to reduce future drought impacts, a new paradigm called “drought risk management” is needed that is proactive and directed at identifying who and what is at risk, why they are at risk, and how individuals can prepare for drought events beforehand, as well as how to improve their response during drought events (Hayes et al. 2011).  The components of drought risk management include drought early warning, drought planning, and the identification of appropriate mitigation strategies. Drought early warning involves the continuous assessment and anticipation of the natural indicators of drought severity, spatial extent, and impacts, and then these data are used to elicit an appropriate and timely response (Hayes et al. 2012).  Drought early warning is required so that decision makers can implement effective drought policies and response and recovery programs.  Early warning is essential for drought risk management plans and illustrates an important connection between proactive risk management strategies and post-event responses (Wilhite and Buchanan-Smith 2005). The U.S. Drought Monitor One example of an evolving early warning system is the U.S. Drought Monitor (USDM) product, which is a weekly assessment of drought conditions for the United States [http://droughtmonitor.unl.edu].  It is constructed through a partnership made up by the National Oceanic and Atmospheric Administration (NOAA), the United States Department of Agriculture (USDA), and the National Drought Mitigation Center (NDMC).  After its first release in 1999, the USDM has gradually becomean important tool for policy-makers and for communication about real-time drought conditions, especially for the media. Several of the original USDM objectives are still applicable in 2013.  The product was designed to give a simple representation of drought severity and extent by showing four drought categories on a map (with a fifth “abnormally dry” category) distinguished by a ranking percentile scale and a recognizable color scheme.  The product is flexible in considering multiple components of the hydrological cycle depending upon what is available, including climate parameters, reservoir and lake levels, streamflows, groundwater levels, soil moisture, snowpack, remote sensing information, and others.  The percentiles, if possible, allow the conditions to be placed into historical context with an approximate return period established. One unique feature of the USDM is that a great effort has been made to engage a network of local drought experts with knowledge specific to their region to provide feedback on the map development process each week.  Approximately 350 local experts are now part of this network nationwide, and the input these experts provide weekly is critical to the success of the USDM product.  In addition to the local network, the USDM partner organizations have been very intentional about having a USDM-oriented stakeholder forum held each year at various locations around the country, as well as in Mexico and Canada.  These forums have been a rich source of suggestions and feedback related to the USDM product, and have provided excellent opportunities for information sharing among scientists and between the scientists and stakeholders. The USDM had a humble beginning back in 1999.  The keys to it becoming the successful drought early warning system that it is today includes the commitment of the original partnership, which is a great example of the cross-agency interaction and collaboration that is necessary to monitor drought conditions.  Another key is that its consistent availability, as well as the involvement of local experts, which has successfully built the trust that allows it to be a reliable and useful tool for policy and decision makers. The USDM as an International Model Using the USDM as a model for drought early warning systems, any country has the capacity to develop a similar system adapted for the unique characteristics and based on the indicators for the hydrological cycle available for that country.  The important ingredients for success would include the establishment of strong partnerships and the commitment to provide a product in a consistent fashion.  To assist nations with improving drought early warning, and perhaps adopting a USDM system approach, the United Nations has launched an Integrated Drought Management Program (IDMP) with the objective of offering assistance to nations looking for better scientific understand of issues like drought early warning.  As nations take these steps, hopefully the escalation of future economic impacts from drought events will not occur. Source - https://www.agriskmanagementforum.org

27.02.2014

Endangered forests - Google has released the world forests map: Global Forest Watch

Google, in collaboration with the Institute of World Resources and 40 other organizations, has developed a new project called Global Forest Watch, which provides view on tendency of forestlands decrease and increase worldwide. One can find on the project’s website photos from NASA satellites for the last 13 years of observations. Image processing algorithm performs a detailed calculation of felling and planting of forests worldwide. For example, Russia for 2000-2013 felled 36.5 million hectares and planted only 16.2 million hectares (1st place in the world for the forest losses); Ukraine: -565 hectares and +353 hectares, Belarus: -416 hectares and +375 hectares. Deforestation concerns a great number of countries worldwide. Project’s summary shows that over the last 13 years, only few countries managed to increase forestlands. "By the time we learn about deforestation it can be too late to do anything - Google says in press release. - Scientists have been studying forest regeneration for centuries, pointing to the vital importance of this ecosystem to human society. However, most of us still do not have updated and accurate information about where, when and why forests are disappearing. And Global Forest Watch project should change it». The $25 million project will provide necessary information to ecologists and activists about what is happening in their country and surrounding areas. Project’s site plans an option of notification about deforestation in a given location, in the nearest future. Source - www.agroinsurance.com 

24.02.2014

USA - Preventing trich vital for cattle ranchers

Excellent rainfall during 2013 across much of Oklahoma allowed drought-stressed pastures to rebound. These rainfall events in central and eastern parts of our state saw many ranchers rebuilding cattle numbers. While rebuilding, many producers have had to make decisions about bulls for the next breeding season. While doing so, herd health and reproductive disease have been major considerations in the context of what age and type of bulls are being purchased. Perhaps the one reproductive disease for which bulls play a critical role in transmission is that of Trichomoniasis, or “trich.” This disease has been around for generations and, for many years, was thought to be something only states west of the Rocky Mountains had to be concerned with. This is not the case today; many states now have this disease within their borders. Trich is a highly contagious sexually transmitted disease in cattle that results in abortions and infertility and is caused by a microscopic protozoan parasite Tritrichomonas foetus. The organism colonizes in both bulls and cows, and as bulls age, conditions on the surface of reproductive organs are more conducive for this protozoa to survive and multiply. Infected bulls and cows look and act normal. The only way to confirm Trichomoniasis infection is by testing. Typically, cattle producers become aware of a problem when cows are pregnancy checked and there are too many open cows, a prolonged calving period or noticeably reduced calf crop. Reabsorption of the fetus or abortion usually occurs early (one to four months) in pregnancy and females become temporarily infertile. Late-term abortions have been reported but are not common. The majority of infected cows will clear the infection within four to five months of sexual rest. Immunity to Trichomoniasis is short-lived, and cows are susceptible to reinfection and abortion the following season. Some cows will not clear the infection. Bulls become infected with the Trichomoniasis protozoa when breeding infected females. Those bulls younger than 3 may clear the infection, but bulls older than 3 are generally permanently infected. Although the primary impact of Trichomoniasis is reduced fertility in cows and cows spread the infection to bulls, Oklahoma Trichomoniasis regulations center on bulls. Bulls act as a reservoir for this organism and are the primary method of transmission. Identification of infected bulls is critical. Producers should work closely with a veterinarian who is certified to collect samples for the necessary testing to identify any Trichomoniasis infected bulls in their herds. The most effective way to control Trichomoniasis is to prevent the introduction of the organism into a herd. This is primarily accomplished through testing all new bulls prior to entry into the herd and preventing unwanted bulls from entering through damaged fence lines. Keeping young bulls rather than older ones and testing all bulls prior to each breeding season are also important tools. Establishing a defined breeding season and early pregnancy diagnosis will aid in rapid detection of reproductive losses caused by Trichomoniasis. As with most infectious diseases, a biosecurity plan is critical to preventing introduction and/or controlling the organism within a herd. A vaccine for Trichomoniasis is available and labeled for use in controlling the disease in cows. The vaccine will reduce the reproductive losses associated with the disease and may reduce the time it takes a cow to clear the infection. However, in most herds, managing the risk factors for Trichomoniasis through biosecurity is less more effective than vaccination. Producers are encouraged to work with their veterinarian to develop appropriate protocols for controlling Trichomoniasis and other reproductive diseases in their herds. For bulls entering Oklahoma, applicable tuberculosis and/or brucellosis entry, requirements must be met and the shipment must have a valid Certificate of Veterinary Inspection. Source - http://www.normantranscript.com/

23.08.2013

Risk management with agricultural insurances

Small-scale farmers in developing countries can no longer absorb the negative impacts of climate threats within their traditional risk management strategy. One supplementary risk management instrument could be agricultural insurances. But they need to be tailored to the specific needs particularly of small-scale farmers, a great challenge for the insurance providers. 
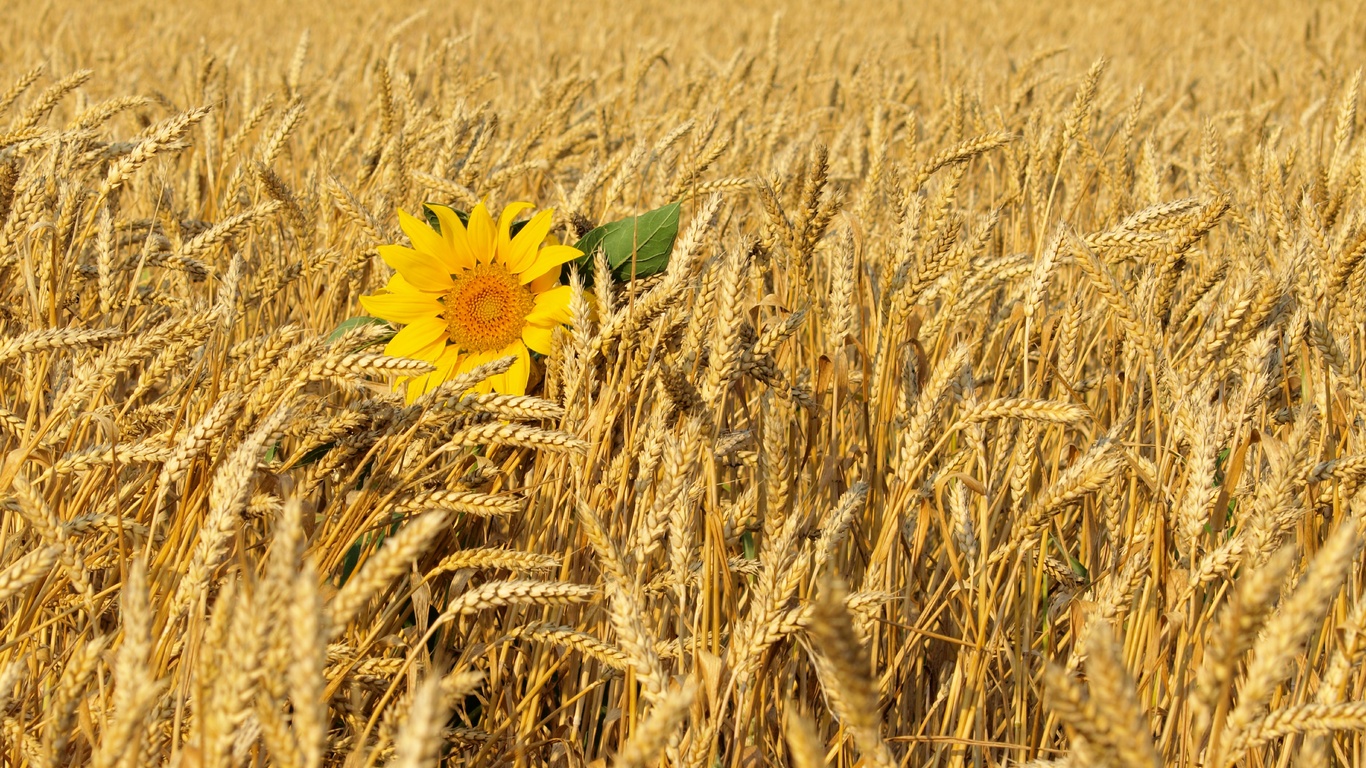
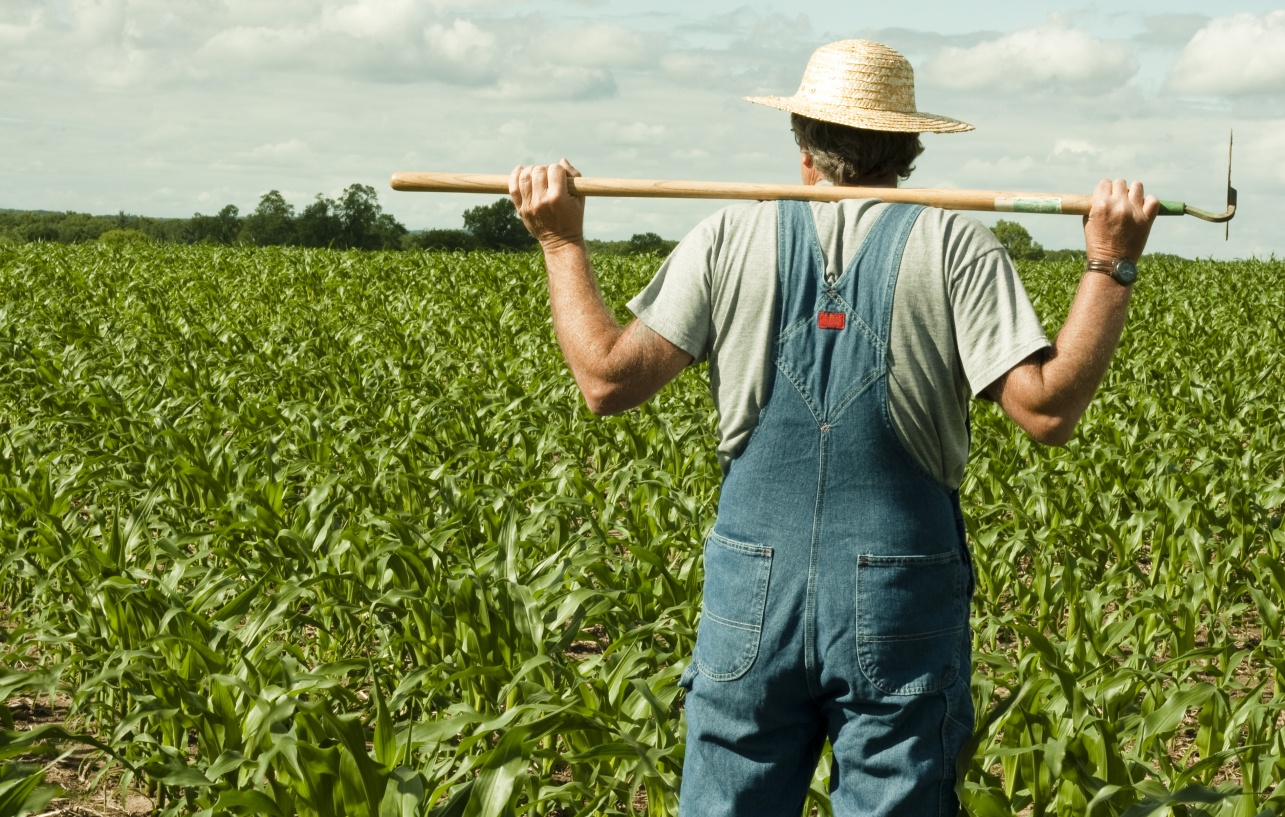
Agricultural activities strongly depend on climatic conditions, and agriculture is subsequently exposed to significant economic risks. Farmers have always developed strategies to successfully manage the economic risk of agricultural production, by measures either to reduce or to adjust to climatic risks; for example, diversification of agricultural production, intercropping, agro-forestry or investment in cattle in order to save money for hard times are traditional methods of many small-scale farmers in Africa and Asia to cope with unfavorable climatic conditions. New threats to agricultural production Risk management strategies are not set in stone; agricultural producers continuously have to adapt their instruments to changing frame conditions and new challenges; as a consequence of this, risk management strategies which used to be perfectly adjusted to a specific ecologic and social environment might be outdated after essential parameters have changed. Globalization and increasing integration of small-scale farmers in developing countries in global markets, for example, are bringing about new threats and significantly raise farmers’ price and marketing risks. Agricultural producers and politicians therefore have to work out new strategies to get a grip on the increased price and marketing risk, for example by developing of contract farming arrangements. 
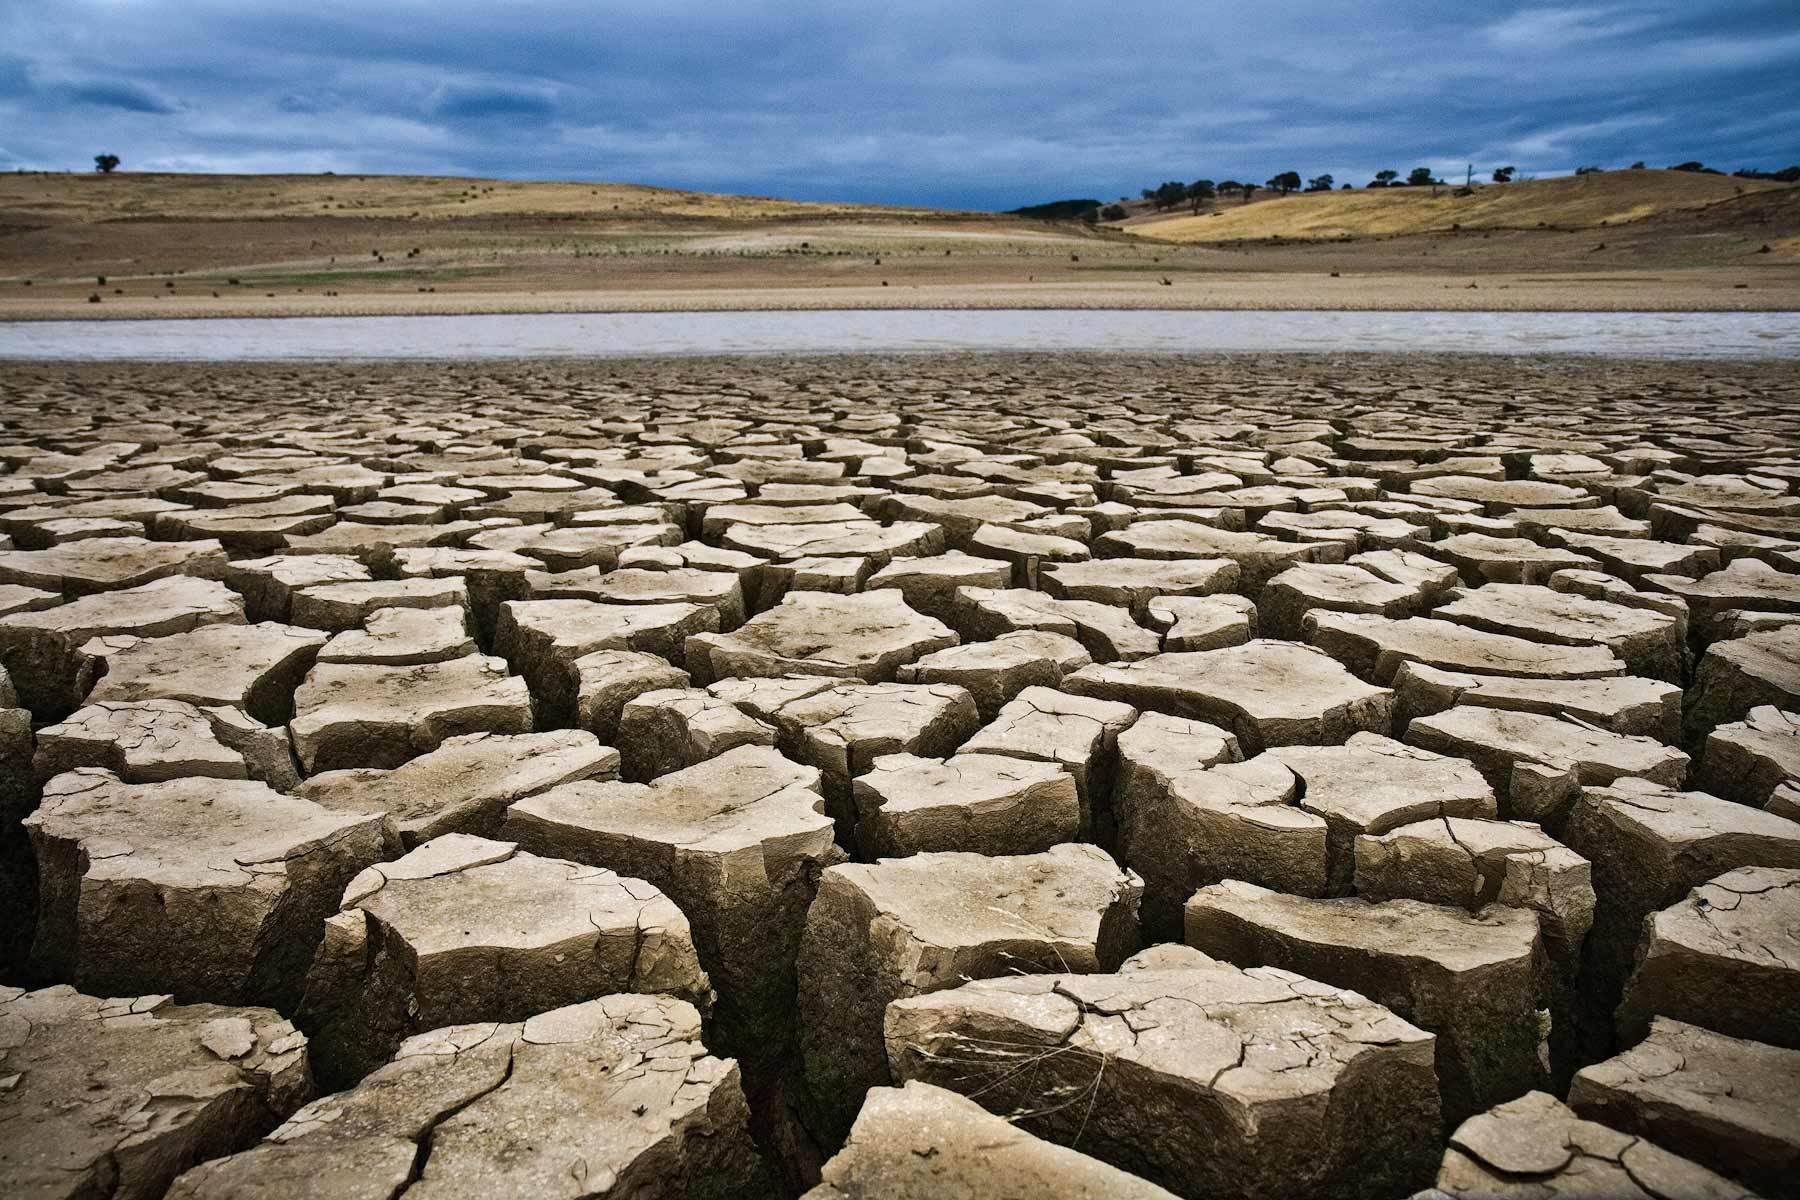
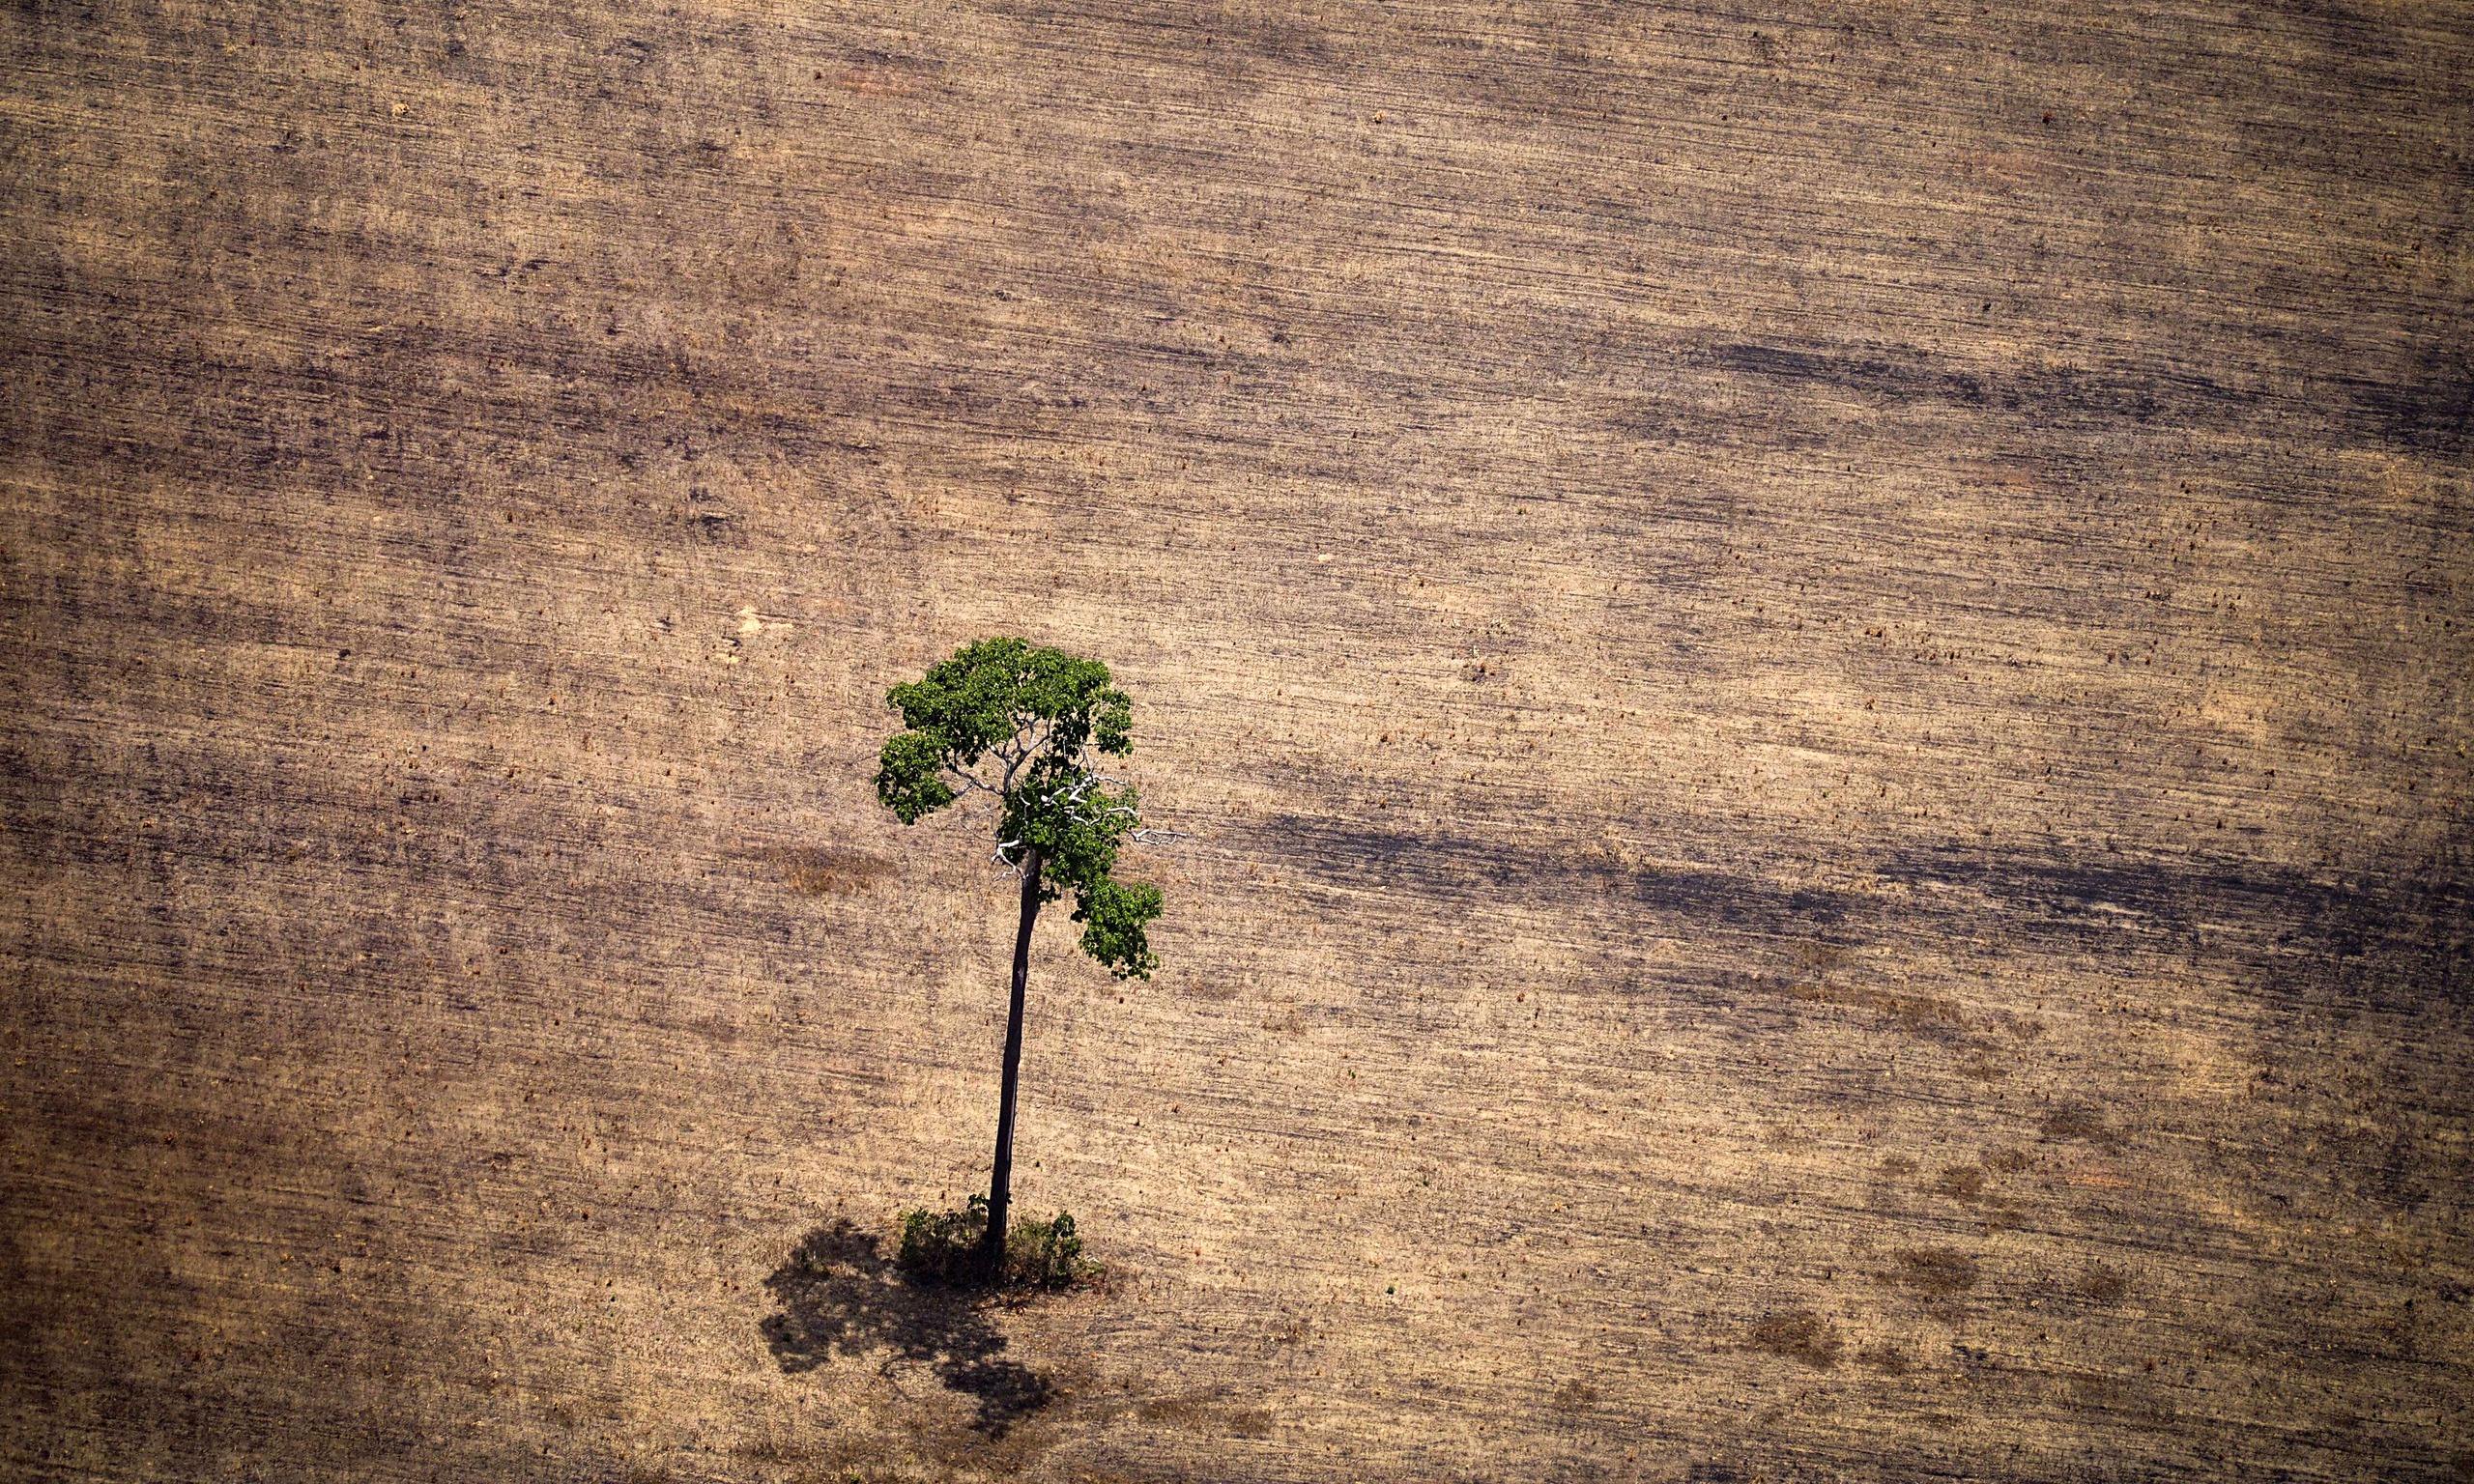
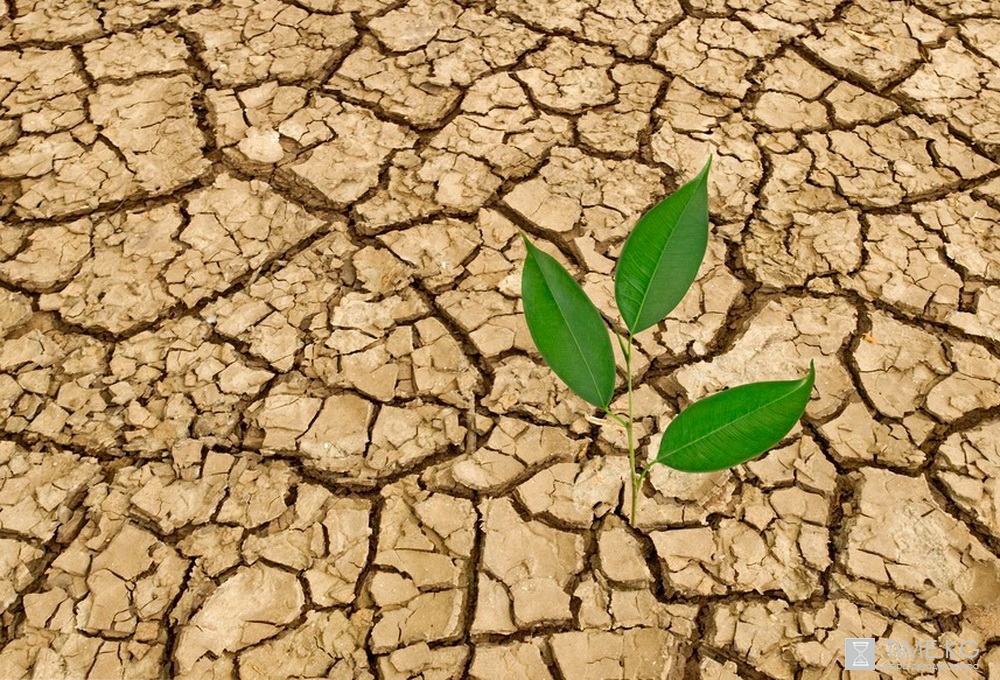
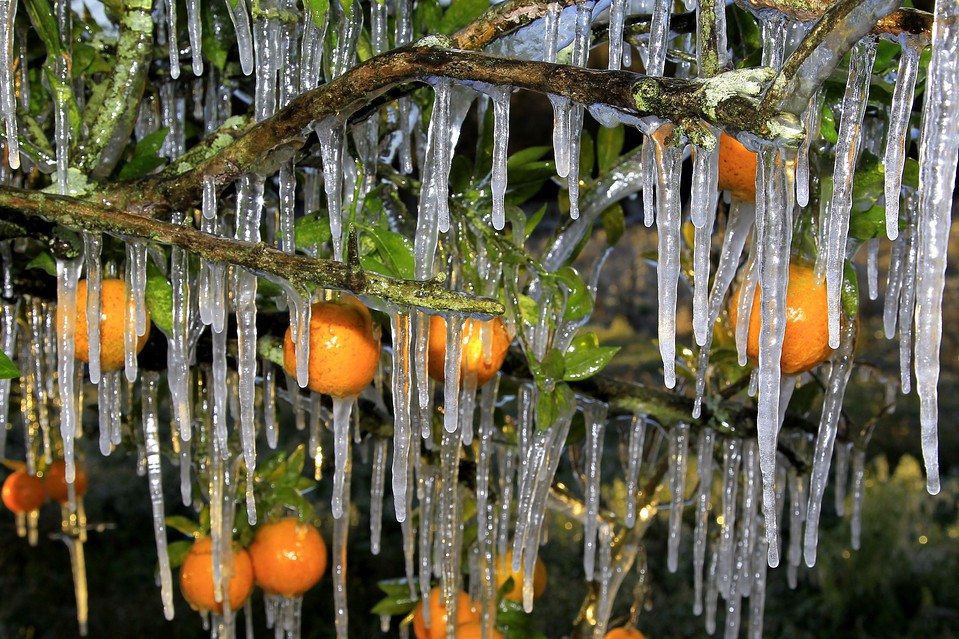
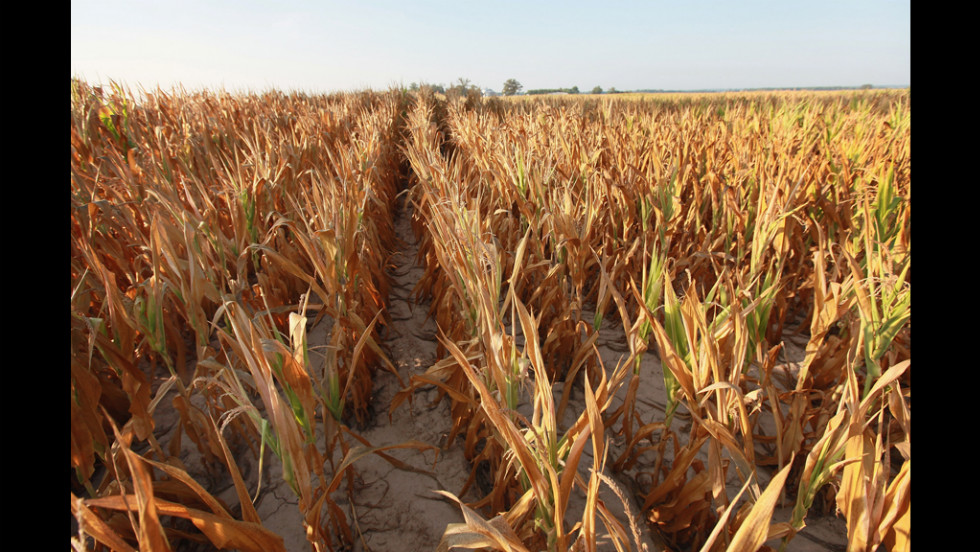
However, the biggest challenge to agricultural production arises from the emerging climate change, which is leading to an accumulation of extreme weather events, particularly droughts, spillages and strong storms. Agricultural yields in Asia, for example, are expected to drop by 15 to 20 percent by 2050 due to serious droughts in the context of climate change. Because of the dimension that the negative impact of climate change has on glob al agricultural production, small-scale farmers in developing countries can no longer absorb the negative impacts of climatic threats within their traditional risk management strategy but have to look for supplementary risk management instruments to deal with the new dimension of climatic threats. Insurances a way out? The majority of the people living in rural areas in developing countries earn a living with agricultural activities; if partial or even total crop failure is caused by extreme weather events, they therefore run the risk of having to live at subsistence level or falling into the poverty trap. Agricultural and disaster insurances warrant financial compensation in case of crop failure, are subsequently means to stabilize income of rural households in the event of harvest failures and thus help farmers to avoid slipping into poverty. Apart from stabilizing household income, insurances have a positive influence on agricultural investment and subsequently contribute to increased agricultural productivity. Small-scale farmers usually behave risk-averse in order to ensure a minimum level of household income; however, this also means that they are avoiding investing in new technologies which are more productive and profitable. Reducing economic risk through agricultural insurances therefore contributes to farmers being willing to, and interested in, applying new technologies and techniques. Finally, insurances linked to agricultural credit programs increase the creditworthiness of loan applicants and thus support investment in agricultural production, too. In Europe and North America, agricultural insurances are a widespread means of risk management which is used by lots of farmers. Yet, despite the many positive impacts of insurances on agricultural development, hardly any agricultural and disaster insurances are available in developing countries and economically emerging nations. Weak institutional and political frame conditions on one side and the structure of the agricultural sector, consisting mostly of small-scale farmers, on the other hamper the successful development and implementation of agricultural insurances in developing countries. Beyond that, agricultural insurance presents a particular challenge worldwide to insurers because of specifics of the agricultural sector. Roughly speaking, challenges inherent in the design of insurance products become greater when insurance is applied to agriculture and even greater when it is applied to small-scale agricultural producers. The concept of risk pooling 
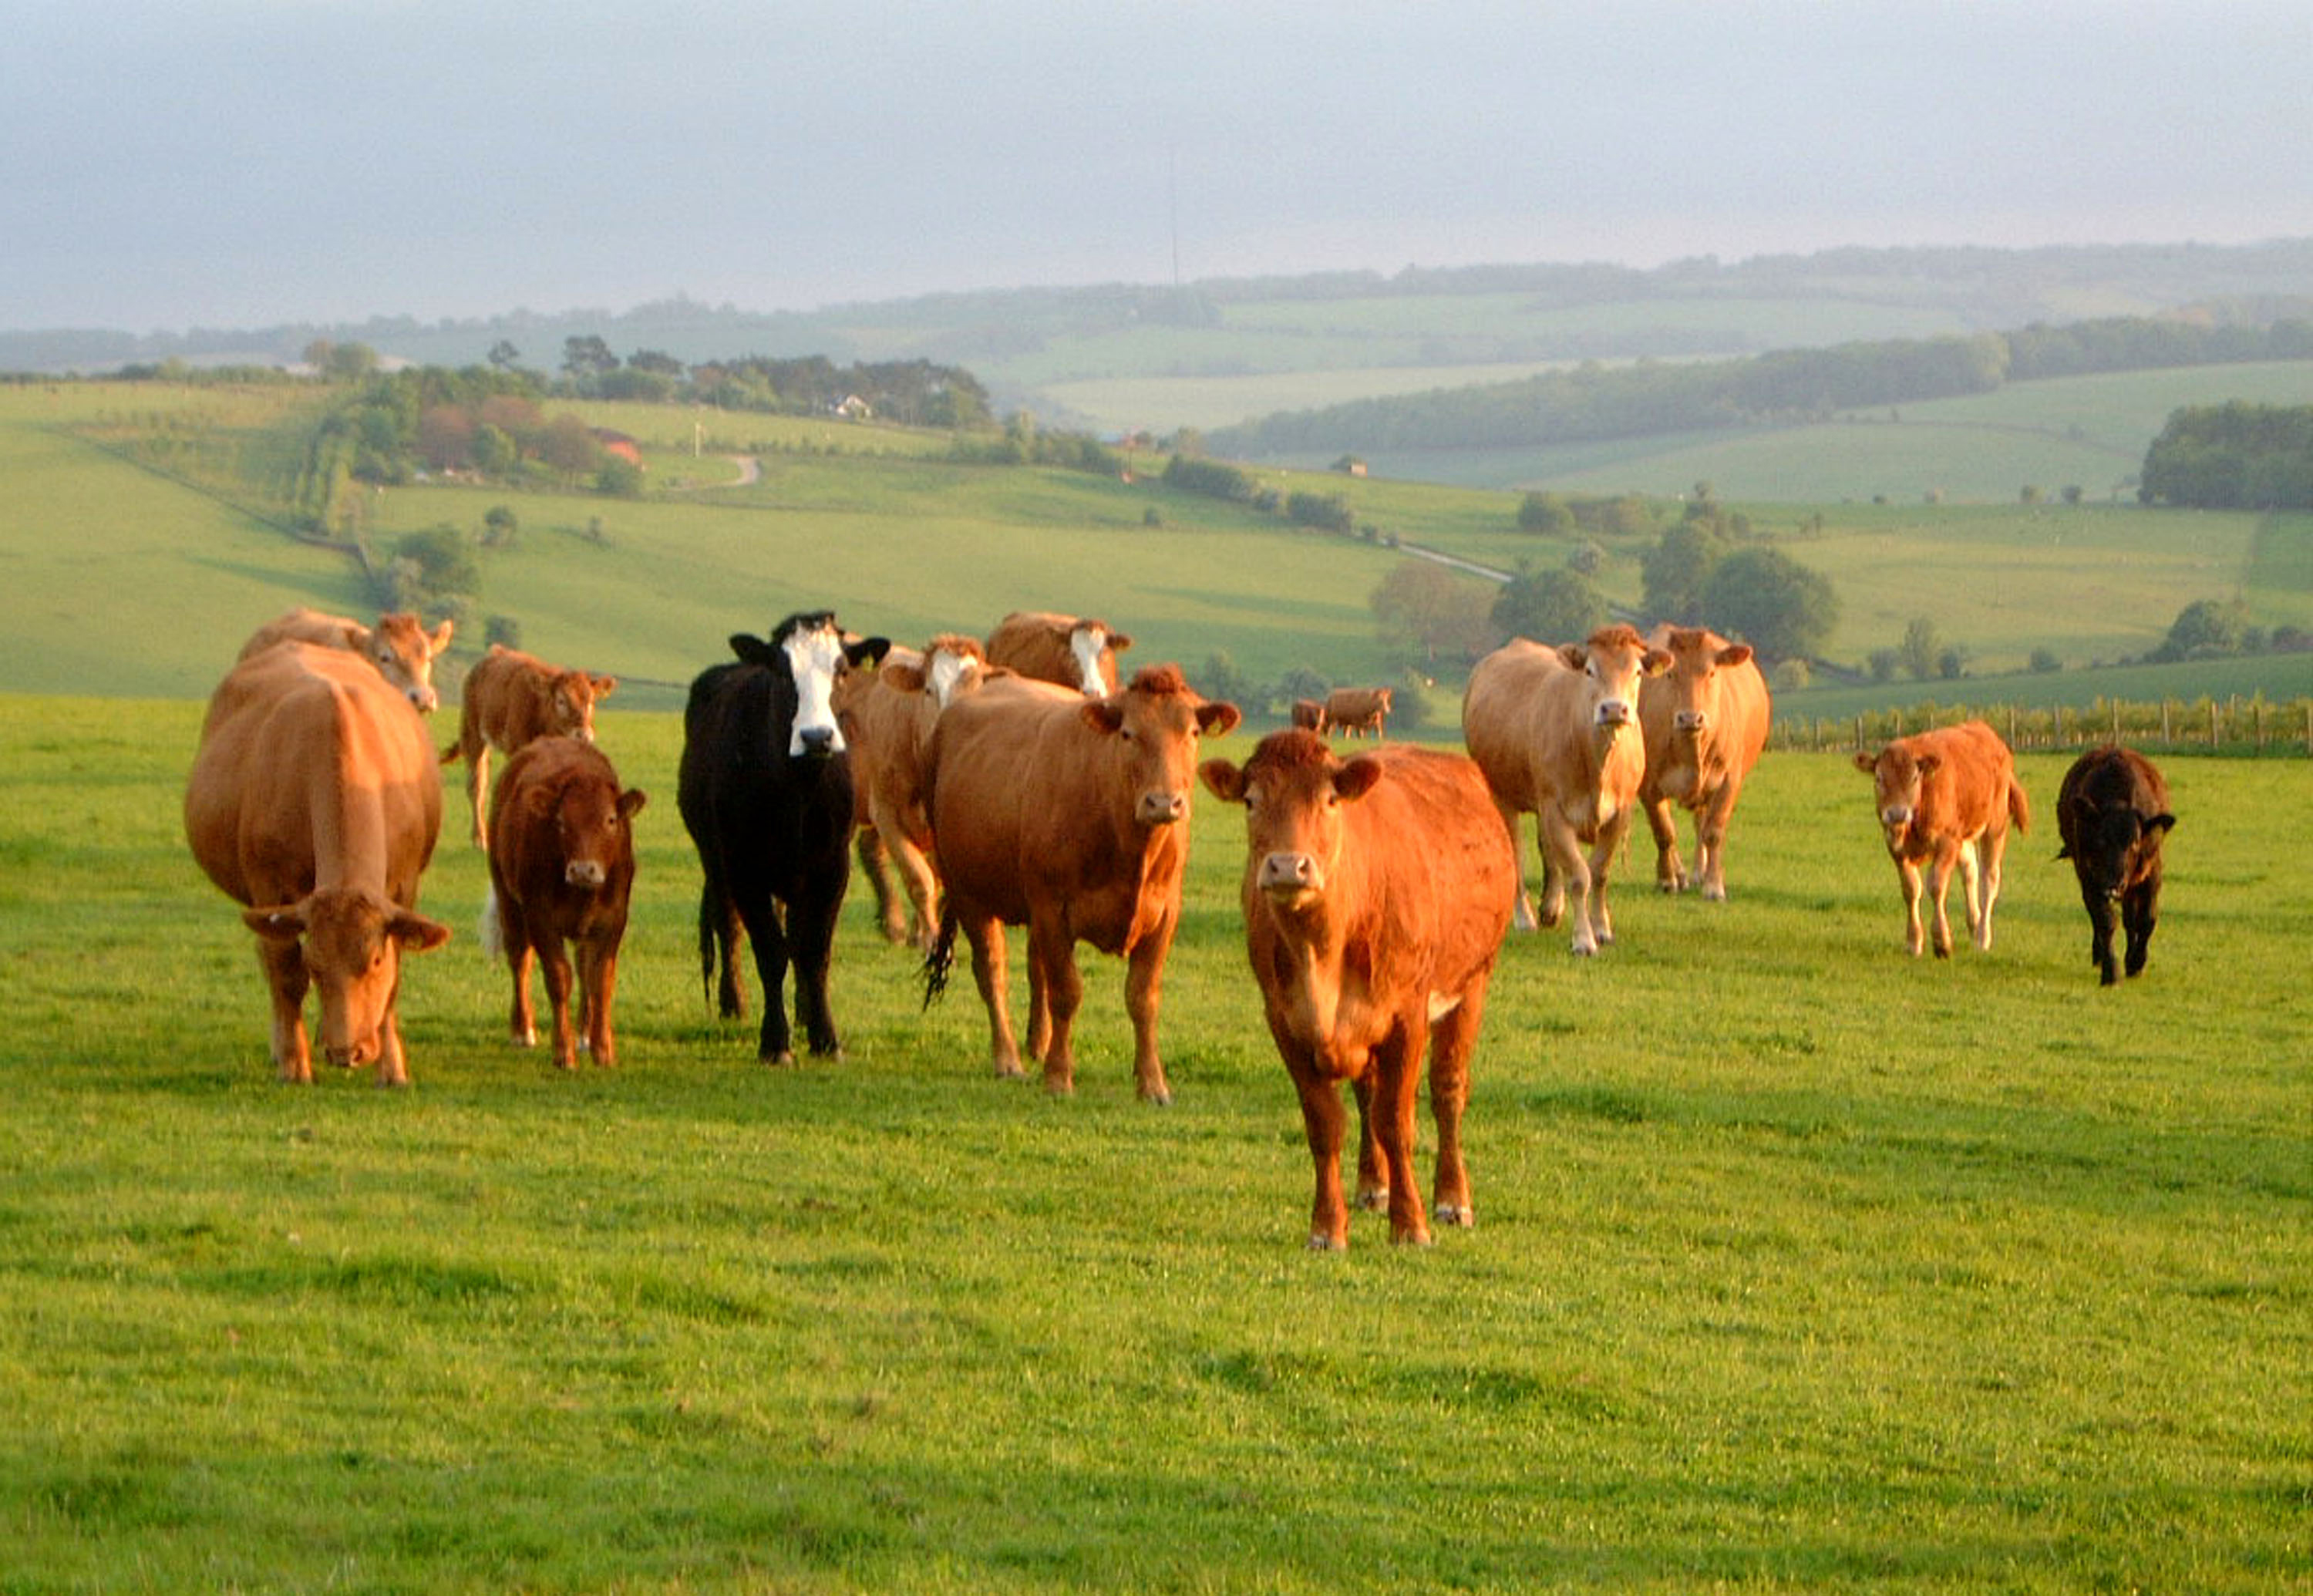
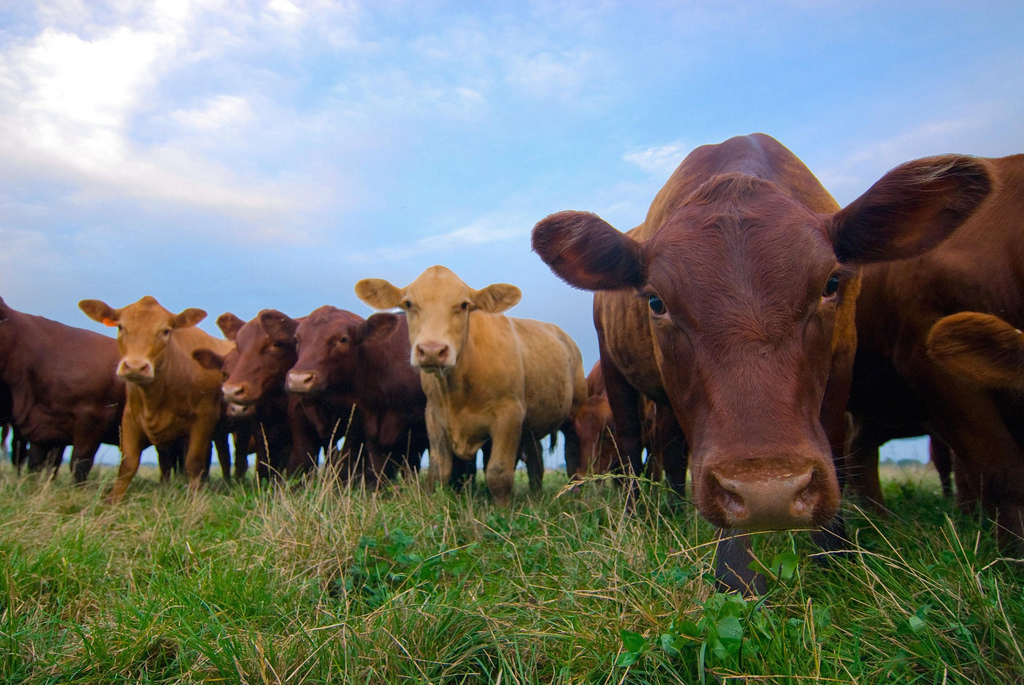
Like all other insurances, agricultural insurances are risk-pooling instruments and can be described as the reimbursement of an individual for all or part of the financial loss caused by an unpredictable event or risk. Everyone participating in the risk-pooling instrument pays a small amount of money (premium) into the pool, which will be used to compensate those who suffer the loss by the determined risk or unpredictable event. If, for example, a group of 1,000 farmers puts aside one US dollar a month for the insurance to cover the death of their animals up to a value of 100 US dollars (USD) per animal, the farmers will collect 1,000 USD in premiums each month which is used to pay the claims. For a small-scale farmer, it is not easy to find the 100 USD to replace the animal, and the one USD monthly premium payment is subsequently an effective investment. However, not all events are insurable, and the concept of risk pooling works best if the following conditions are met: insurable events must occur unpredictably, and there should be a low probability that the event will happen; for example, no insurer will insure a farmer against floods if he/she cultivates agricultural crops on a flood plain which is flooded every year. Furthermore, the insured event should not be under the control of the insured person, otherwise he or she can manipulate the event in order to get the benefit of the insurance. In addition, the events should be statistically independent; if risks among participants of an insurance scheme are not independent from each other, the principle of risk-pooling and risk-sharing between members will not work properly. Finally, it should be easy to determine whether the insured event has occurred or not. Paying under these rules, life insurance is, for example, an easy to develop and subsequently cheap insurance product: the event is mostly unpredictable, not under the control of the insured individual, it is statistically independent since not all insured persons will die at the same time and easy to determine. Contrary to this, agricultural risks are very difficult to confine and to capture: for example, neighboring farms with identical soil conditions may have very different yields depending on the technical skills of the farmers. This means that the insured event is, to some extent, under the control of the insured person and does not merely result from the insured event. Furthermore, assessing agricultural loss can be very difficult, as the loss could be caused by a combination of the insured event and other incidents. Moreover, physical remoteness of the farms supports opportunities for fraud and thus strengthens the complexity of agricultural insurances. The complexity of agriculture insurance Agricultural risks, like droughts, pests or flood, usually affect many farmers at the same time. However, the concept of risk-pooling does not work if all or a major part of the insured persons claim for indemnification simultaneously. This would overburden the financial capacity of any insurance company and would make it fail. Reinsurance companies, like Munich Re and Swiss Re, are therefore especially important in all kinds of agricultural insurance schemes since the reinsurers provide insurances to insurers against catastrophic risks. The above described characteristics of the agricultural sector make the development and implementation of agricultural insurances very time-consuming, and the products are subsequently very costly. This is the reason why hardly any agricultural insurance can cover its costs with premiums. Most therefore have to be subsidized by governments. However, because of the strategic role that the agricultural sector has for the entire economy, most governments are willing to subsidize agricultural insurances. Another challenge is the structure of small-scale agriculture in developing countries which is characterized by low productivity and low income and by operating in large and remote areas. The resulting overhead costs would lead to large premiums in excess of the financial capabilities that poor farmers have. However, the new instrument of agricultural microinsurances may provide innovative insurance products at affordable prices which are adapted to the socio-economic situation of poor small-scale farmers. Index-based microinsurance for the poor Microinsurances are an important pro-poor financial service along with other microfinance services such as savings, lending, and cashless payments, which serve the specific needs of low-income people with limited or no previous exposure to insurances. Index-based agricultural insurances are microinsurance schemes which are characterized by uniform contracts for all insured persons and by standardization of payments of damages: the insurance company does not insure an individual farmer against his/her individual loss, but does insure certain values of a fixed index in a region; this means that insurance companies warrant compensation to all insured farmers in a region if the fixed event, the index, occurs. This permits low-cost loss control, subsequently reduces transaction costs for implementation of the agricultural insurance scheme and thus allows small premiums which can be afforded by low-income farmers. Indexes have to make sense for the farmers through close correlation with actual losses, but also have to ensure cost-effective insurance products for the insurance companies. However, as simple as it sounds, the precise definition of indexes to measure the damage is very complicated and, according to international insurers, takes years. Furthermore, the development of appropriate indexes strongly depends on the availability of reliable data giving information on historical patterns of agricultural production and long-term weather statistics, whilst the situation in many developing countries is often characterized by undependable data and by an inadequate infrastructure to collect reliable information. Yet, innovative methods to collect data on agricultural production and weather data through remote sensing or GIS help to overcome this bottleneck. Despite the promising prospects of index-based insurances as a risk management instrument for small-scale farmers at affordable premiums, the development of agricultural index-based insurances is still in its infancy and so far, there are only few efficient index-based insurance systems (such as crop insurance in Malawi and livestock insurance in Mongolia. Finally, agricultural microinsurances supplement but cannot replace a comprehensive risk management strategy of farmers. Author contact: Gertraud Faltermeier Deutsche Gesellschaft für Technische Zusammenarbeit (GTZ) GmbH Division 45 – Agriculture, Fisheries and Food Eschborn, Germany Gertraud.Faltermeier@gtz.de

04.07.2013

Drought Risk Reduction - Changing the Paradigm for Drought Management

Drought is a common feature of the landscape in virtually all climatic regions of the world.  In fact, it is a normal part of climate, rather than apart from it.  Droughts differ from one another in terms of three important characteristics—intensity, duration, and spatial extent.  The frequency and severity (intensity) of drought varies markedly from region to region and, as a result, keeping the attention of water managers, policy makers, and the public on its improved management once it has abated has typically been difficult.  Thus, moving societies from a reactive approach to drought management (i.e., crisis management) to a more proactive, risk-based management approach has been a significant challenge. The crisis management approach that has historically characterized government and donor-driven response to drought throughout the world is illustrated by what I refer to as the hydro-illogical cycle (picture right). Drought is a slow-onset, creeping phenomenon.  Absent a comprehensive, integrated early warning system that gathers and assesses the status of water supplies on a regular basis and communicates that assessment to decision makers, the severity of drought often goes undetected until a water shortage reaches crisis stage.  Once we have reached a state of crisis, there are few alternatives other than providing relief to the most drought-affected sectors.  However, studies have shown that drought or disaster relief does little to reduce societal vulnerability to the next event. It could even increase vulnerability because it encourages the status quo in terms of resource management practices.  In other words, vulnerability to drought is often the direct result of poor planning and resource management. If we are to reduce societal vulnerability to drought, we need to encourage improved planning and resource management by redirecting a significant portion of the funds spent on disaster relief to mitigation programs that target those people and sectors most at risk and, thus, create a greater coping capacity through improved resource management. Changing the Paradigm To break the hydro-illogical cycle, nations need to establish national integrated drought monitoring and early warning information systems that compile information continuously on the status of all segments of the hydrologic cycle and deliver that information to decision makers quickly so risks can be reduced through the implementation of pre-determined mitigation actions. Needed information includes not only precipitation deficiencies and temperature anomalies but also the status of surface and groundwater supplies, soil moisture, snowpack, and vegetation. Long-term climate forecasts, although not always reliable for many regions, may provide usable information for decision makers as well, especially in areas where phenomena such as El Niño and La Niña result in significant climatic anomalies.  Additional research should also be directed to the identification of the key causes of drought in various regions in order to improve seasonal forecast skill to enable better planning. In the United States, the development of the U.S. Drought Monitor in 1999 signaled a new approach to monitoring drought across the nation.  This approach integrates information on a weekly basis from a wide range of sources on many drought indicators and indices to inform managers, policy makers and the public on the severity of drought conditions across the country.  The preparation of this weekly map is a collaborative effort between the National Drought Mitigation Center (NDMC) at the University of Nebraska, the National Oceanic and Atmospheric Administration (NOAA), and the U.S. Department of Agriculture (USDA).  This integrated approach for characterizing drought conditions in the United States can be used as a template for other countries, basing their characterization of drought conditions and severity on a broader range of variables than precipitation alone.  The development of the National Integrated Drought Information System (NIDIS) by NOAA for the United States in 2006 represents the next step in integrating information, including impacts, into national assessments of drought severity and spatial extent. However, the development of integrated drought monitoring and early warning information systems is only the first step that nations can take to be better prepared for future drought conditions.  A national, regional, or provincial/state based drought mitigation plan should also be developed and implemented.  A drought mitigation plan has these essential elements: Monitoring, early warning, and information delivery systems, including integrated monitoring of key indicators, the use of appropriate indicators and indices, and the development of decision support tools; Risk and impact assessment, including monitoring and archiving of drought impacts;  and Mitigation and response measures to lessen impacts and increase coping capacity. Source - https://www.agriskmanagementforum.org

29.11.2012

In a World of Climate Change There is a Growing Need for Climate Forecasting

In late October 2012, the largest Atlantic hurricane on record slammed into New York, one of the world’s most populated cities and one of its leading financial and economic centres. “Super-storm” Sandy grounded air traffic and a massive storm surge flooded the city, forcing authorities to close the New York Stock Exchange for the first time since 9/11. In preparation for the impact of Sandy the city closed its subway system. The only other time this has happened was when New York steadied itself for Hurricane Irene last year. A Changing Climate While it is tempting to look at Irene and Sandy as part of a trend towards more freak storms, whether these events are the result of global climate change or just the consequences of a period of heightened Atlantic hurricane activity won’t become clear for some time. But one of the notable comments we can make about Sandy is the way Atlantic climate models very accurately forecast the path of the storm. This allowed New Yorkers to prepare for the impact of the hurricane and evacuate if they wanted to. Almost a week before the storm hit New York the European Centre for Medium-Range Weather Forecasts (ECMWF) indicated that Sandy would travel up the Eastern seaboard and then take a weird left turn and plough straight into the most populated area of the U.S. This was all the more remarkable when you consider that Atlantic hurricanes rarely turn west and move inland. What some of the models were showing had never actually materialised in the past. Bracing for Hurricane ImpactNevertheless, climate modelling allowed people to batten down the hatches and prepare for the impact of Hurricane Sandy. Critically, the accurate forewarning allowed the Federal Emergency Management Agency (FEMA) and others to prepare. Despite these measures the toll was horrific: At least 253 people were killed along the path of the storm. Meanwhile catastrophe modelling firm RMS placed the upper limit of insured losses at $25 billion; other estimates for total economic losses, including business interruption, are in the realm of $50 billion But it could have been so much worse if the storm had struck completely out of the blue. While it may never be possible to predict some natural disasters, like earthquakes, improved climate modelling is making a real difference to how we respond to severe storms and hurricanes. As technology improves and investments are made in faster and more powerful computers, which are capable of processing millions of calculations a second, we’re getting better at predicting how a storm will behave weeks in advance. Not only does this help communities withstand these shocks better—the improved forecasting also gives insurance companies more confidence and enables them to mitigate people’s losses and help people get back on their feet. Climate Forecasting But for me the really exciting thing is forecasting what the climate (the prevailing meteorological conditions, including temperature, precipitation and wind) will be like months or even years ahead of time. As we come to terms with a changing climate and possibly more frequent and severe natural catastrophes this is becoming even more important. Recent torrential rain and high winds across much of the UK, resulting in widespread flooding, is further evidence of how our climate might be changing. Of course we all know that our seasonal forecasts aren’t always spot on. In May this year weather forecasters predicted a sweltering summer on a par with the record-breaking 2003 and 2006 scorchers. A few months later official forecast declared the “wettest summer in one hundred years” and the public were left feeling cheated. But this could all be about to change. The World Meteorological Organisation (WMO) has just approved a global framework for climate forecasting with the aim of creating accurate forecasts for the climate. I can imagine a time in the near future where it is commonplace to have reliable global climate forecasts sitting alongside our annual economic forecasts. This could have all sorts of implications for disaster risk reduction and allow people, governments and businesses to better allocate resources and manage risks. If we could anticipate a wet summer, for example, we could intervene and invest in flood defences to help avoid the worst effects. Today, industrialisation and urbanisation mean that more people than ever are living in areas at risk of natural hazards, particularly in the developing world, and the numbers will continue to rise over coming decades. As exposures increase, the science of climate forecasting will play an increasingly important role in anticipating natural disasters and helping affected populations brace for the impact. Source - http://blog.willis.com/

26.10.2012

Geoengineering Could Be Essential to Reducing the Risk of Climate Change

Using technology to cool the planet may be the only way to deal with the greenhouse gases already in the atmosphere, argues scientist David Keith. Geoengineering—using technology to purposefully change the climate—is the only option for reducing the risk of climate change from greenhouse-gas emissions in the next few decades, says David Keith, a professor of public policy and applied physics at Harvard University. And he says that if it’s done in moderation, it could be much safer than some experts have argued. In fact, says Keith, effective methods of geoengineering are so cheap and easy that just about any country could do it—for better or worse. Keith, speaking this week at MIT Technology Review’s annual EmTech conference, says it is already too late to avoid climate changes by reducing carbon emissions alone. The carbon dioxide that’s been released into the atmosphere by burning fossil fuels is already likely to cause significant harm, such as raising temperatures enough to hurt crop yields in many places. “If you want to, say, really stop the loss of Arctic sea ice or stop heat-stress crop losses over the next few decades, geoengineering is pretty much the only thing you can do,” he says (see “Why Climate Scientists Support Geoengineering Research”). Keith’s preferred method of geoengineering is to shade the earth by injecting sulfate particles into the upper atmosphere, imitating a similar process that happens with large volcanic eruptions, which are known to temporarily cool the planet. The technique could be effective even if far less sulfate were injected than is currently emitted by fossil-fuel power plants. A million tons per year injected into the stratosphere would be enough—whereas 50 million tons are injected into the lower part of the atmosphere by coal plants, he says. (In the lower atmosphere, the sulfates are less effective at cooling because they stay airborne for shorter periods.) One of the main objections to geoengineering is that the measures that might be taken to cool the planet won’t exactly offset the effects of carbon dioxide, so they could actually make things much worse—for example, by altering patterns of precipitation. Keith says recent climate models suggest that injecting sulfate particles into the upper reaches of the atmosphere might not affect precipitation nearly as much as others have warned. “I propose that you start in about 2020, and you start very, very gradually increasing your amount of sulfate engineering so that you cut about in half the rate of warming,” he says. “Not eliminate it, but cut it about in half. Cutting it in half is a big benefit.” One of the benefits could be increased crop production. Though some critics have worried that geoengineering would alter monsoon patterns that are key to agriculture in India, Keith says moderate geoengineering could actually boost crop productivity there by 20 percent, in part by reducing temperatures. Keith and some of his colleagues recently hired engineers to estimate how much one approach to sulfate injection might work, and how much it might cost. It could be done at first with existing airplanes—certain business jets can fly high enough to inject the particles into the upper atmosphere. Eventually we would need new planes that can fly higher. All in all, once the procedure is scaled up it would cost about a billion dollars a year and require about 100 aircraft. That’s cheap enough for most countries to pull off on their own. The fact that it’s easy isn’t necessarily a good thing, Keith says. There’s the potential that if one country does it, another might blame that country—rightly or wrongly—for ensuing bad weather (see “The Geoengineering Gambit”). And there are also real concerns about the impact sulfates might have on the atmosphere (see Geoengineering May Be Necessary, Despite Its Perils). It’s known that sulfates can be involved in reactions that deplete the ozone layer. As the earth warms, water vapor levels are increasing, which could exacerbate the problem. Keith is proposing a test to discover quantitatively just what the effect of the injections could be. He would introduce small clouds of sulfate and water vapor into the stratosphere using balloons, and then carefully measure the reactions that take place. And Keith acknowledges a concern many have had about geoengineering: that using it to offset problems from climate change will reduce the incentive to tackle the greenhouse-gas emissions at the root of the problem. Even if geoengineering is employed, reducing emissions will still be important. Sulfate injection does nothing to address the ocean acidification associated with increased levels of carbon dioxide in the atmosphere. And if emissions continue to grow, ever-increasing amounts of sulfate will be needed. But Keith thinks the potential benefits might be worth the dangers. “We don’t know enough yet to start,” he says. “But the current balance of evidence is that doing this really would reduce risks. And for that reason, we’ve got to take it seriously. It really would be reckless not to look at something that could reduce risk like this could.” Source - http://www.technologyreview.com/

15.10.2012

Relative Importance of Price vs. Yield Variability in Crop Revenue Risk

Managing crop revenue risk is of critical importance for financial success by agricultural producers and a central theme of many government commodity and insurance programs. Debate surrounding the farm bill for example, includes various programs intended to limit revenue variability that arises from low crop prices, production declines as might happen under a drought, and so forth. Crop insurance is critical for most commercial scale producers to protect against the consequences of poor relative crop performance or price declines, but is remains debated whether price risk or yield risk is more likely to influence insurance payments. In general, farm-level crop revenue risk results from price variability, yield variability, relationships between prices and yields, and relationships among the crops produced. It is important to first understand the underlying causes of crop revenue risk to better assess the effectiveness of various strategies and programs that might be used to mitigate crop revenue risk. Improving the understanding of the relative influences of price and yield risk is the intent of this farmdoc daily post. To begin, it is clear that in the heart of the Corn Belt, prices and yields tend to move in opposite directions. This negative correlation is particularly evident this year as evolving prospects for lower yields due to widespread drought have led to commensurate market price increases resulting from efforts to balance supply and demand factors. Likewise, each crop production report release, acreage or yield estimate revision, or update to estimates of world production and use is met with price responses of the opposite direction compared to the understood impact on production. Aggregate level effects are relatively most pronounced, and while intense production areas have generally similar effects, the strength of the relationship tends to decline down to the individual producer level, but overall maintains the negative relationship between price and yield. This effect is sometimes referred to as the "natural hedge" and the size of its impact could be useful to better understand. There are various technical methods for decomposing variability into source components, but applications to farm revenue series are complicated by the evolving yield levels (trending upward) and by price regimes that seem to have epochal differences in general levels through time due to new markets such as ethanol, and year-to-year effects from carryover supplies and acreage shifts through time. Measuring the correlation at a point in time is thus an inexact idea, but there are useful approximations that can be used. To begin to address this issues, yield data for each of the counties in Illinois were collected and detrended, or put onto a current basis using methods similar to those used by the Federal Crop Insurance Corporation to detrend yields under the Trend-Adjusted APH Endorsement. Failure to control for the trends through time can result in substantially overstated measures of risk. In essence, the impact of yield increases through time is added back to historic yields so that deviations around a current yield that would be expected from the historic deviations from trend can be used to proxy yield risk at a point in time. Prices present a bit more of a challenge. For the analysis presented below, the perspective of the modern crop insurance program provides a useful guide. Each year, the Projected Price is established at roughly the time of planting decisions using the futures markets to determine. The Harvest Price is then determined during the month of October (historically November, as well), as a proxy for actual available price to a farmer. A constant basis is assumed through time, and while that may not be a good assumption for many local markets, it does not materially affect the conclusions related to sources of risk. To construct the associated "current" price distribution, each year's percentage price change from Projected to Harvest price was computed and the distribution of price changes applied to a base price from this year's experience. All results are presented for corn. Soybeans have similar but somewhat more muted features and slightly higher shares of price risk and slightly lower correlation effects. The graph below helps illustrate the resulting measures and show the movements in prices and yields within a year are generally opposite in sign and of roughly similar magnitudes in most cases. Price-yield correlation This process was repeated for each county in Illinois and the degree of relatedness summarized in terms of the correlation.1 The figure below summarizes the results. As shown, the most intense production regions generally have the strongest (most negative) relationship between yields and prices. Overall, the state average price-yield correlation is -.51 with a low of -.72 and a high of -.31. The correlation can generally be interpreted as the average proportionate change from one to the other, so a value of -.51 would imply that prices and yield respond in opposite directions with about half as large a relative magnitude - or that 51% of an increase in one variable is offset by a decrease in the other. Next, a current revenue distribution was constructed for each county using the detrended yields and associated normalized price series. The expected or average revenue cannot be constructed by simply multiplying the average price times the average yield due to the correlation effect. In technical terms, the expected product of price and yield is equal to the product of the averages plus the covariance. In this case, the covariance is negative as described above, so the actual average revenue is less than the simple product of the average price and average yield, but the revenue risk is also proportionately lower the more negative the correlation as well. These relationships lead to a natural question: Which is more important to revenue variability, price or yield; and what role does the negative correlation play in mitigating the risk? Revenue variability To decompose the revenue variability, a simple technique was used that allows an analog of the risk from price to be isolated as well as the risk from yield. First, from a series of related yields and prices through time, the price is held constant at its mean and the revenue variance calculated allowing the actual yield changes observed. Then, the yield is held constant and the revenue variability calculated allowing the actual price changes observed. If there were zero correlation, the sum of these would equal the total observed risk.2 The actual total risk, however, is less than the sum by the amount that must be attributed to the effect of the negative covariance. The process of first holding prices constant and using actual yields, and then holding yields constant but reflecting actual price changes, and then comparing the total component variance to the actual was done for each county in Illinois for corn from 1975 to 2011. The fractions of the total variance and impact of correlation were then calculated. The table below contains results for selected representative counties around the state, and the average across all counties. Consider Adams County where the actual average revenue per acre for corn is $832.77 and the standard deviation of revenue is 127 using the procedures outlined above. The share of the variability attributable to price risk is 58% and the share attributable to yield risk is 42%. The Covariance effect reduced the actual variance from the component variance by 60%. In other words, if the price and yield were completed independent and varied with no relationship to each other, the actual variance of revenue would have been 60% higher. Likewise, had the price and yield series been independent, the actual average revenue would have been $845.59 implying that the covariance also reduced the average revenue by about $12.82/acre. Alexander County has the highest share of yield risk of any county in Illinois at 50% while the relatively lower yield risk counties such as Christian, DeKalb, and Sangamon represent low yield risk cases where price is the primary driver of revenue variability. Across the state, price risk represents about 66% of the cause of revenue variability and the natural hedge or negative correlation reduces the total risk by 47% compared to a case of independence. Overall, the price risk is found to be generally more influential on revenue variability than yield risk, and the correlation effects result in nearly a halving of the total variability compared to complete independence. These results do help support anecdotes that crop insurance has become a price risk program as much as a yield risk program, but that interpretation also adds to its usefulness in managing crop revenue risk. Areas of the state with relatively risker production have larger shares of overall crop revenue risk from yields, but the price and correlation effects are still at least as important. Source - University of Illinois

15.10.2012

Price vs. Revenue Farm Safety Net

Introduction An issue of disagreement during the 2012 Farm Bill debate is whether the farm safety net should focus on revenue or price. Until the ACRE program was enacted in the 2008 Farm Bill, farm programs focused on price. This article compares price and revenue programs, focusing on the key role played by the correlation between changes in price and changes in yield. The examination finds that converting to a revenue based farm safety net likely will likely increase the effective risk management provided by the farm safety net and will likely result in more support being provided to Southern crops. Importance of Price-Yield Correlation It is common to think of revenue per acre as (price times yield). However, this perspective is not appropriate if the objective is to manage risk. Risk management seeks to manage the negative impacts of changes. The risk of a negative change in revenue depends not only on the risk of an adverse change in price or yield, but also on the correlation between the changes in price and the changes in yield. The price-yield correlation is important to understanding both the management of revenue risk and the design of public policy to help farmers manage risk. Figure 1 presents the correlation between year-to-year percent changes in average U.S. yield per planted acre and year-to-year changes in average U.S. price over the 1973 through 2006 crop years for barley, corn, upland cotton, oats, peanuts, rice, sorghum, soybeans, and wheat. Planted acres for corn and sorghum are adjusted for acres harvested for silage. Yield per harvested acre is used for oats because oats is often planted as a cover crop. The 1973-2006 crop seasons are analyzed because prices were stationary over this period. Stationarity is an important consideration to maintain the validity of statistics calculated over time. The price-yield correlations vary substantially among the crops, ranging from -0.21 for upland cotton to -0.78 for soybeans (see Figure 1). A negative correlation means that year-to-year percent changes in U.S. average price and U.S. average yield are inversely related: if yield increases, then price usually decreases, and vice versa. The closer a correlation is to -1, the more closely the percent changes in price and yield are related to each other. The higher negative correlations for U.S. soybeans and feed grains (corn, sorghum, barley, and oats) were expected because of the importance of these U.S. crops in world trade. The price-yield correlations are lowest for the crops associated with the U.S. South. In addition, the correlations for soybeans, sorghum, oats, and corn are different than the correlations for peanuts and upland cotton at the 95% statistical confidence level. Ninety-five percent is a commonly-used statistical test level. It is possible that these correlations have been influenced by U.S. farm programs that existed over the 1973-2006 analysis period. Since U.S. farm programs are different today and will likely change in the future, this constraint on any analysis that uses historical U.S. data for crops needs to be kept in mind. Because of this concern, several alternative analyses were conducted. The results of these analyses, particularly the relative ordering of values across crops, generally held. Price Variability vs. Revenue Variability Even though the variability of revenue includes the variability of yield as well as the variability of price, a large enough negative correlation between price and yield changes can result in the variability of revenue being less than the variability of price. This situation is often referred to as the "natural hedge." U.S. revenue is less variable than U.S. price for all the crops examined in this study except for peanuts and upland cotton (see Figure 2). Variability in Figure 2 is measured as the percent difference between the standard deviation of the year-to-year percent changes in revenue and price. Standard deviation is a commonly-used measure of risk. To illustrate the interpretation of the values in Figure 2, standard deviation of the year-to-year percent changes in U.S. revenue for soybeans (12%) was -37% less than the standard deviation of the year-to-year percent change in the U.S. price of soybeans (19%). (Calculation: -37% = (1-(12%/19%)) Comparing Figures 1 and 2 reveals the expected relationship: the more negative is the U.S. price-yield correlation, the less variable is U.S. revenue relative to U.S. price. For example, soybeans and sorghum have the most negative yield-price correlation and the lowest U.S. revenue variability relative to U.S. price variability. On the other hand, upland cotton and peanuts have the lowest yield-price correlation. They are also the only two crops in this study for which U.S. revenue variability exceeded U.S. price variability. Peanuts stand out as a deviation from the generally consistent relationship between the price-yield correlation in Figure 1 and the variability of revenue relative to price in Figure 2. A key reason is the 1980 crop year. U.S. average yield per planted acre of peanuts declined by 53% from the yield for 1979, then rebounded by an almost identical 55% in 1981. The next highest year-to-year yield decline was 26% in 1993. Eliminating 1980 from the analysis reduced the difference in revenue variability relative to price variability for peanuts from 80% to 39%, or by half. Policy Implications The correlation between price and yield and the resulting impact on revenue vs. price variability has important implications for farm policy. One implication is that a revenue program with identical parameters to a price program should be less costly. The reason is the high negative price-yield correlation for soybeans and corn. These two crops account for over 50% of all U.S. crop acres. This implication is examined by using the parameters specified in the Senate Farm Bill for the County Agricultural Risk Coverage (ARC) program and applying them to a program for U.S. revenue and U.S. price. Thus, per acre payment from a Revenue ARC program equals: [(89% times 5-year Olympic moving average of U.S. price times 5-year Olympic moving average of U.S. yield) minus (U.S. yield times U.S. price for the crop year)]. Per acre payment from a Price ARC program equals: {[(89% times 5-year Olympic moving average of U.S. price) minus (U.S. price for the crop year)] times (5-year Olympic moving average of U.S. yield)}. The revenue payment per acre and price payment per unit of crop are capped at 10%. Payment is made on 80% of planted acres. Payments are estimated at the U.S. national level over the 1978 to 2006 crop year. The reason for starting with 1978 instead of 1973 is that a 5-year Olympic average is calculated of U.S. price and U.S. yield. For the 9 crops examined in this study, payments from the Price ARC program totaled $22.7 billion over the 1978-2006 crop years (see Figure 3). In comparison, payments by the Revenue ARC program totaled $18.5 billion, or 18% less. Thus, as expected, payments from the revenue program were less than payments from a price program with identical parameters. However, farm bills work with a budget constraint and it is reasonable to assume that Congress will spend the entire allotted budget for a given program area. Thus, another perspective and one that is probably more appropriate is that spending on a revenue program would be made the same as spending on a price program by increasing the coverage of a revenue program. For example, to achieve the same level of spending on price and revenue ARC programs, the coverage level would be 91.5% for a Revenue ARC program in contrast to the 89% coverage rate for the Price ARC program (see Figure 4). Thus, for the same cost to the U.S. government, the Revenue ARC program would provide more risk protection than the Price ARC program. Another policy consideration is that the distribution of payments across crops will vary for identically parameterized price and revenue programs. Due to similar yield-price correlations, payments are grouped together for soybeans, sorghum, oats, and corn; for barley, wheat, and rice; and for peanuts and upland cotton. The share of payments going to soybeans, sorghum, oats, and corn was higher for the price ARC program than for the identically parameterized revenue ARC program (see Figure 5). This finding reflects the greater variability of U.S. price than U.S. revenue for soybeans, sorghum, oats, and corn, which in turn reflects the high negative price-yield correlation that exists for these crops. On the other hand, the share of payments going to upland cotton and peanuts was higher for revenue ARC program than for the identically parameterized price ARC program (see Figure 5). This finding reflects the greater variability of U.S. revenue than U.S. price for peanuts and upland cotton, which in turn reflects the low negative price-yield correlation that exists for these crops. The middle price-yield correlation group of barley, wheat, and rice had more payments under a revenue ARC program. The likely reason is the large savings generated by the high negative price-yield correlations for soybeans, sorghum, oats, and corn, in combination with the large share of U.S. acres devoted to these crops. Upland cotton had a disproportionate change in its share of payments. It accounted for 6.4% of Price ARC payments and 10.5% of Revenue ARC payments. To assess how sensitive the change in the distribution of payments was to the large change for upland cotton, it was removed from the analysis. While the size of the redistribution effect was smaller, the same redistribution of payments from soybeans, sorghum, oats, and corn to the other crops was observed when upland cotton was removed from the analysis. Summary Revenue programs are a more encompassing risk management program than price programs because revenue includes yield as well as price. In addition, because the large acreage crops of corn and soybeans have a more negative price-yield correlation than most of the other program crops, a revenue program will cost less if identically parameterized to a price program. These savings can be used to increase the coverage level of a revenue program relative to a price program, further enhancing the ability of revenue programs to provide risk management assistance relative to price programs. The price-yield correlation varies by a statistically significant amount across U.S. crops historically associated with the farm safety net. It is most negative for the Midwestern and northern Plain State crops and is closest to zero for the Southern crops of upland cotton, peanuts, and rice. The differences in price-yield correlation mean that the variability of revenue is relatively greater for the Southern crops while the variability of price is relatively greater for the Midwest and northern Plain state crops. Because variability is a key factor in determining payments by a risk management program, revenue programs should make relatively more payments to the Southern crops while price programs should make relatively more payments to the Midwest and northern Plain state crops. In conclusion, converting from a price based farm safety net to a revenue based farm safety net likely will increase the effective risk management provided by the farm safety net and likely will result in relatively more support being provided to Southern crops. These implications reflect that revenue risk is not just about price risk and yield risk, but also about the correlation between price risk and yield risk. Sources for Figures: calculated using data from U.S. Department of Agriculture, National Agricultural Statistics Service, QuickStats, available at http://www.rma.usda.gov/data/sob.html This publication is also available at http://aede.osu.edu/publications. Issued by Carl ZulaufDepartment of Agricultural, Environmental and Development EconomicsThe Ohio State University

16.11.2010

Radar tech takes aim at fruit frost

Adapting technology originally developed to detect and identify aircraft, the tech company Raytheon has developed a device that delivers radar waves to stop crops from freezing. To test the Tempwave's effectiveness at warming crops, Raytheon, working with a large citrus grower, Paramount Citrus, recently tested the Tempwave system on a quarter acre plot of naval oranges near Visalia, Calif. During the course of several nights the temperature in the orange grove dropped to 28 degrees Fahrenheit. Raytheon's team placed one Tempwave antenna, about 30 feet tall and bulb-shaped, on each corner of the four acre plot and let them run through the night. Without any system to warm the fruit, the oranges would have frozen and become unsellable. The naval oranges made it thought the night unscathed. When the mercury drops, farmers may soon have a new tool to protect their valuable crops. Adapting technology originally developed to detect and identify aircraft, the tech company Raytheon has developed a device that delivers radar waves to stop crops from freezing. "This is essentially a radar that doesn't detect anything," said Larry Farrier, a project manager who helped develop the Tempwave crop warming system. "Tempwave delivers energy to the crops, which is absorbed, and freezing is prevented." Currently farmers have several options to protect crops like apples, oranges and other fruit. Large fans can mix warm air across the crops. Sprinkler systems can surround fruit with a protective layer of ice. As a last resort farmers can start bonfires and then circulate the hot air past freezing crops to prevent individual cells in the fruit from freezing and bursting. To test the Tempwave's effectiveness at warming crops, Raytheon, working with a large citrus grower, Paramount Citrus, recently tested the Tempwave system on a quarter acre plot of naval oranges near Visalia, Calif. During the course of several nights the temperature in the orange grove dropped to 28 degrees Fahrenheit. Raytheon's team placed one Tempwave antenna, about 30 feet tall and bulb-shaped, on each corner of the four acre plot and let them run through the night. Without any system to warm the fruit, the oranges would have frozen and become unsellable. The naval oranges made it thought the night unscathed. Each of the four antennae emit low powered radar waves tuned specifically to water molecules. Much like a microwave, the radar waves cause water molecules to vibrate and heat up just enough to keep them from freezing. The radio waves are relatively low energy are completely safe for humans to work around, says Farrier. "We aren't trying to keep the fruit at room temperature here," said Farrier. "We are just trying to shine enough energy on them so they don't freeze." This winter's test was small scale. In a full-scale system one antenna would provide enough energy to heat one acre, instead of four antenna for one-fourth an acre. Farrier says that while the Tempwave system provides just enough energy to stop it from freezing, it's completely safe for humans to work around. "I was in the field during the experiment and it was a cold morning," said Farrier. "I was hoping I would be warmed up and I wasn't." Raytheon hasn't announced a firm price yet, although Farrier says that Tempwave will be competitive with other crop protection systems, somewhere between $2,000 and $3,000 an antenna. The price is essential, says Paramount Citrus president David Krause, who while involved with the trials hasn't decided if he will purchase the system yet. "The technology provides us with a novel way to protect crops in a more environmentally and cost effective manner," said Krause. "The alternative is to use electricity to pump water, burning fuel to drive propellers, or to just burn fuel to raise the temperature, which can damage crops and is costly." Tempwave might reduce the fuel cost of orchards another, more indirect way as well. Last year Raytheon developed a similar heating system using radio waves that would heat oil locked inside shale, making it easier to retrieve. Raytheon sold the oil heating system to Schlumberger, an oil field services company. Among other civilian applications, Raytheon engineers are also investigating whether radio wave heating could be used to incubate chicken embryos inexpensively, instead of using traditional heat lamps. "We are trying to look at world problems, and see if we can adapt core Raytheon technology to develops solutions that can address those problems," said Farrier © 2009 Discovery Channel

16.11.2010

Drought and Heat Stress Effects on Corn Yield Potential

The combination of high temperatures and inadequate moisture has created severe stress in many corn fields. As dry weather continues, more corn fields are showing signs of moisture stress with leaf rolling evident during midday hours. In many stressed fields, soil moisture is available but it appears beyond reach of most corn roots. Current weather conditions are inhibiting root development. In addition to water deficits, high soil temperatures are limiting root growth near the soil surface. The corn canopy shades the soil surface and moderates soil temperatures, but many corn fields have yet to canopy. Plants with root systems restricted to the upper four to five inches of the soil profile are stunted. Scattered thunderstorms during the past weekend brought relief to some localized areas, but cooler weather and the possibility of more storms forecast for the coming week may ease the stress somewhat. To estimate the impact of dry hot weather on corn yield potential, let's review the effects of moisture deficits on corn growth and development from the late vegetative stages, prior to pollination, to the dent stage of kernel development. Yield losses to moisture stress can be directly related to the number of days that the crop shows stress symptoms during different growth periods. The following summarizes findings of Iowa research by Claassen and Shaw on effects of drought on grain yields in corn. This Iowa data is widely used in estimating the potential impact of water stress on yield potential. Vegetative Stages: Drought stress during early vegetative growth usually has a negligible impact on grain yield. However, during later vegetative stages, when kernel numbers per ear are determined, plants are more sensitive to stress. According to Claassen and Shaw's findings, four days of stress (i.e. corn wilted for four consecutive days) at the 12th-14th leaf stage has the potential of reducing yields by 5-10 percent. Kernel row numbers on the ear are determined by the 12th collared leaf stage and the potential number of kernels per row is complete about one week before silking. Tassel Emergence: As the tip of the tassel begins to emerge from the whorl, the upper stalk internodes rapidly elongate and the ears begin to expand. Silks from the base of the ears are also rapidly elongating. Four days of moisture stress at this stage has the potential to reduce yields 10 to 25%. Silk Emergence to Pollen Shed: At this stage, leaves and tassels are fully emerged and the cobs and silks are growing rapidly. This is the most critical period in terms of moisture use by the plant. Four days of moisture stress at this stage has the potential to reduce yields 40-50%. Blister Through Dent Stage of Kernel Development: About 12 to 36 days after silking, the cobs, husks and shanks are fully developed and the kernels are increasing in dry weight. Moisture stress will reduce kernel fill from the ear tip down. Four days of drought at the blister stage has the potential of reducing yields 30-40%, and at dough stage, 20 to 30%. Where dry weather has contributed to corn stands with uneven emergence, and development, yield loss may range from 5 to 20% depending on various factors such as the length of emergence delays and the percentage and distribution of later emerging plants. Where there is considerable variability in plant size, smaller, stunted plants will be at a competitive disadvantage with larger plants for nutrients, water and sunlight. Effect of drought on corn yield Stage of development Percent yield reduction (from 4 consecutive days of visible wilting) Early vegetative 5-10 Tassel emergence 10-25 Silk emergence, pollen shedding 40-50 Blister 30-40 Dough 20-30 Peter Thomison

16.11.2010

The OIE and risk management instruments for epidemic livestock diseases

World Organisation for Animal Health (OIE) is an intergovernmental organisation. It was founded in 1924. Today 170 countries are the members of OIE. The OIE provides technical support to Member Countries requesting assistance with animal disease control and eradication operations, including diseases transmissible to humans. The OIE notably offers expertise to the poorest countries to help them control animal diseases that cause livestock losses, present a risk to public health and threaten other Member Countries. The OIE’s objectives: •          To ensure transparency in the global animal disease and zoonosis situation •          To collect, analyse and disseminate scientific veterinary information and disease control methods •          To provide expertise and encourage international solidarity in the control of animal diseases •          To improve the legal framework and resources of national Veterinary Services •          Within its WTO mandate, to ensure sanitary safety of the global trade of animals & animal products while avoiding sanitary barriers, by publishing health standards Each Member Country undertakes to report the animal diseases that it detects on its territory. The OIE then disseminates the information to other countries, which can take the necessary preventive action. This information also includes diseases transmissible to humans and intentional introduction of pathogens. Information is sent out immediately or periodically depending on the seriousness of the disease. This objective applies to disease occurrences both naturally occurring and deliberately caused. Dissemination is via the OIE Web site, e-mail and the following periodicals: Disease Information, published weekly and the annual compilation World Animal Health.” The OIE provides technical support to Member Countries requesting assistance with animal disease control and eradication operations, including diseases transmissible to humans. The OIE notably offers expertise to the poorest countries to help them control animal diseases that cause livestock losses, present a risk to public health and threaten other Member Countries. The OIE has a permanent contact to international regional and national financial organizations in order to convince them to invest more and better on the control of animal diseases and zoonosis. Key OIE instruments & tools •          OIE Reference Laboratories / Collaborating Centres •          Laboratory Twinning •          OIE (national specialist) focal points •          OIE animal disease notification system •          OIE World Animal Health and Welfare Fund •          The OIE-PVS Tool •          OIE Economic studies Reference laboratories are Expert Centres for worldwide standardisation: -       Store and distribute reference reagents -       Develop / conduct / validate diagnostic tests -       Coordinate technical and scientific studies -       Provide technical and scientific training -       Organise laboratory proficiency testing Collaborating Centres: -       Expert Centres on horizontal subjects, for the OIE and Member Countries and Territories Assist in the elaboration of procedures to harmonise animal disease regulations / international standards -       Coordinate collaborative studies -       Provide technical training -       Organise and host scientific meetings for the OIE -       Extending the network of OIE capacity, expertise and standards through Laboratory Twinning -       To provide regional support with better geographical coverage for diseases and topics that are a priority in a given region -       Improved access for more countries to high quality diagnostics and expertise National specialist focal points: -       aquatic animal diseases, -       wildlife, -       sanitary information systems, -       veterinary medicinal products -       animal welfare -       disease information Unique global network receiving permanent capacity building input from the OIE The OIE-PVS Tool /1 - Evaluation of the Performance of Veterinary Services - a tool for Good Governance of Veterinary Services. 91 countries have been already evaluated. The OIE-PVS Tool /2 - Diagnostic tool for the evaluation of performance of Veterinary Services •          First step in a process to improve VS performance in key areas, including: •          Surveillance networks •          Early detection and rapid response capacities •          Vaccination •          Compensation schemes •          Improved veterinary governance is key for better risk management: “Prevention is better than cure” The EU experience proves that costs of epidemic livestock diseases can be high. Roughly 1 billion ? was spent by EU between 1997-2005, mainly on FMD.  Understanding the risk: Economic studies •          Since 2007, the OIE commissioned four economic studies on prevention and control of animal diseases, co-financed by the World Bank and (partly) the EC •          The first study, comparing prevention versus outbreak costs, focused mainly on Highly Pathogenic Avian Influenza and confirmed that the cost of preventing animal diseases are significantly less than those associated with managing outbreaks Understanding the risk: Overview of studies •          Prevention and control of animal diseases worldwide             I. Prevention vs outbreak costs             II: Feasibility of a global fund for emergency response in developing countries             III: Feasibility of supporting insurance of disease losses •          Cost of National Prevention Systems for Animal Diseases and Zoonoses Supporting insurance of disease losses – study focus •          Overview of epidemic livestock disease insurance products available in some markets, and determination of barriers that prevented their development in others •          Analysis of preconditions for market-based insurance products in developing and in-transition economies Insurance sector in emerging markets Insurance sector in emerging markets remains limited in comparison to industrialized countries (Average per capita non-life premiums >$3,000 in industrialized countries compared to <$100 in emerging markets). But growth rates of premium income have been stronger in emerging markets. Reasons: •          Liberalised domestic insurance markets, which were prevously dominated by state owned insurers •          International insurance groups have increased their involvement (joint ventures, acquisitions) Agricultural insurance Rural markets remain unattractive to insurers due to significant difficulties for insurance companies to penetrate into rural areas: •          Small farm size •          Low insurance awareness •          Low economic capacity •          Poor rural distribution networks •          High rural transaction costs There is strong desire by governments and insurers to improve access to insurance for farmers (microinsurance, weather index-insurance). Penetration for livestock insurance products is  very low for several reasons. Products marketed in developing countries are individual animal accidental mortality policies. Sometime they include limited disease coverage, targeted at high value breeding stock. Epidemic cover is even more limited, and restricted to a few developed countries. Few insurers specialized in agriculture would generally require significant capacity building to become involved in epidemic disease insurance Re-insurance Reinsurance for agriculture is dominated by a few of the major reinsurance companies operating internationally. These reinsurers have found it difficult to meet the demands of insurers in developing countries. Costs of technical assistance high in relation to expected transaction size (poor underwriting results). Loss assessment is difficult for individual-farmer policies. Lack of long term, reliable statistics needed for risk assessment and pricing Pre-conditions for epidemic livestock disease insurance: •          At least one insurance company in the country must be willing and able to take a commercial interest in establishing and distributing an epidemic disease product •          Possibility to set up a pool of insurers •          Likely, such an initiative would only follow a government plan to strengthen disease management and direct compensation, and the support of interested reinsurers Other preconditions: •          Insurable client base of commercial livestock farmers •          Existence of an effective national epidemic disease strategy and operational infrastructure of VS •          Agreed government compensation system for direct losses, backed by access to adequate national or international funding •          Linkage to government compensation programme for declaring outbreak, defining quarantine zones •          Definition of covered / excluded diseases, and diagnostic capacity •          Geographically zoned client and livestock database •          Distribution channel(s) to reach farmers •          Technical assistance •          Access to data and modelling of each covered disease, to permit estimation of maximum probable losses, appropriate financial limits, and setting of premiums •          Access to reinsurance and financial structuring •          Adequate legal and regulatory framework Challenges faced in supporting the development of insurance Need for a well-planned government disease prevention and control programme. Effectiveness of VS influences risk of infection and size of losses. Capacity of VS is crucial (OIE PVS Tool) Financial management of the consequences of disease outbreak, with infrequent but potentially severe claims, require major risk transfer by domestic insurance sectors. International reinsurers would need to play important role, would be more interested in a programme which aimed to develop such cover in many countries, achieving some economies of scale, and some risk spread. Financial structures for national retention of risk, layers of commercial reinsurance, and possibly high-level government-backed catastrophe cover could be foreseen Conclusions There is no “universal” scheme to support the development of market-based insurance products for epidemic livestock diseases can be foreseen which would be suitable for application in all countries. There is a wide diversity between countries in the pre-conditions existing for an epidemic product. There is limited experience, in comparison to other classes of insurance, of epidemic scheme design and of best practices to act as examples for international transfer of know-how. There are high degrees of synergy between the needs of the insurance market in the strengthening of VS, and associated measures, in particular in establishing a database for the registration and identification of livestock herds/owners. The operation of a market-based product would need to be integrally linked to a government compensation system for livestock diseases. Private livestock insurance cannot replace such a system (need of linkage for loss assessment, moral hazard) Dr Frank Alleweldt, Managing Director of Civic Consulting

06.04.2010

FAO - Agriculture and Food Risk Management

Disaster risk management (DRM) is a systematic process of using administrative directives, organizations, and operational skills and capacities to implement strategies, policies in order to lessen the adverse impacts of hazards and the possibility of disaster. FAO maintains the concept and practice of reducing disaster risks through systematic efforts to analyse and manage the causal factors of disasters, including through reduced exposure to hazards, lessened vulnerability of people and property, wise management of land and the environment, and improved preparedness for adverse events. Presentation was done at the International conference agricultural insurance and risk management in Madrid, Spain in March 2010. UN funds, platforms and programmes use DRR as conceptual framework Disaster risk reduction (DDR) The concept and practice of reducing disaster risks through systematic efforts to analyse and manage the causal factors of disasters, including through reduced exposure to hazards, lessened vulnerability of people and property, wise management of land and the environment, and improved preparedness for adverse events. Why does FAO use DRM?    For FAO, DRM goes beyond DRR Disaster risk management (DRM) is a systematic process of using administrative directives, organizations, and operational skills and capacities to implement strategies, policies in order to lessen the adverse impacts of hazards and the possibility of disaster. Disasters have most severe consequences on poor vulnerable and agriculturally-dependent populations. Food and agriculture play a key role in increasing community resilience to likely threats. DRM mitigates impact of crisis and help vulnerable people adapt What is the FAO approach? o   Reduce vulnerability of people before, during and after disasters ·         Continuum covers all phases of the DRM framework from pre-disaster (risk reduction), post- disaster (response, recovery and rehabilitation) to  development ·         Management perspective that combines prevention, mitigation and preparedness with response, recovery and rehabilitation – moving beyond DRR ·         Transition to development provides basis for an integrated DRM approach What are the major common elements of FAO DRM projects and programmes? All phases of DRM framework incorporated Main aim to support national DRM planning processes to reduce vulnerability to natural hazards Three target audiences: local communities and small scale farmers; local Government and national Ministries Baseline assessment – identified good practice Focus on national strategies and programmes Good Practice Examples (2004-2009) Caribbean Region: prevention and mitigation Horn of Africa: preparedness Pakistan: response Indonesia: transition Focus on Prevention and Mitigation - Cuba, Grenada, Haiti and Jamaica Impact mitigation of climatic hazards in agriculture Pilot interventions at community level Integrated preparedness into immediate response and medium term recovery and rehabilitation in agriculture and livestock sector Lessons learned for small farmers to reduce effects of hurricanes, landslides, flooding and drought Good coping strategies: diversified cropping (strip and mixed) control soil erosion (contour) tree management Focus on Preparedness - Horn of Africa Coordination and capacity strengthening for disaster and drought preparedness Reduce vulnerability of agro-pastoralists in Djibouti, Somalia, Kenya, Ethiopia, Uganda Enhance livelihood and drought-related animal production systems Improve food security and early warning (linked to IPC – Integrated Food Security Phase Classification) Enhance community based EWS and contingency planning Create pastoralist farmer field schools Develop guidelines and training based on lessons learned Focus on response – Pakistan Livelihoods Baseline Assessments FAO developed a livelihood baseline with National Disaster Management Authority (NDMA) Evolved into the FAO-ILO Livelihood Assessment Toolkit (LAT) LAT approach used to formulate effective response to 2008 floods and hazard baselines (ongoing) One UN – DRM Joint Programme Focus on Transition – Indonesia Building back better after the tsunami Transition to build capacities of local and provincial authorities as well as vulnerable fishing communities to jointly manage coastal fisheries in a sustainable way Model of post-disaster rehabilitation and transition project – demonstrates how development practices can be applied in relief settings and  emergency projects Develop, introduce and demonstrate good practices for longer-term sustainable development in fisheries Food Chain Crisis Management    Framework based on three main crisis management entities: CMC - Intelligence and Coordination Unit CMC - Emergency Prevention and Early Warning Unit: Based on the Emergency Prevention System for Transboundary Animal and Plant Pest and Diseases (EMPRES). A specific EMPRES component for food safety is under development. CMC - Rapid Response Unit (Animal Health, Plant Health, Food Safety) Food Market Risk Management Managing food import risks rather than trying to change global market fundamentals Global or national stockholding arrangements are inefficient and will not achieve much Reforming existing commodity exchanges is not likely to change fundamentals of commodity markets Unpredictability reduction can be obtained by using either future or options with reasonable cost To increase reliability of global food import markets need better contract enforcement mechanisms An Food Import Financing Facility (FIFF) could go some way to make global food import markets more reliable and avoid policies which may create more global distortions  Jose Mª Sumpsi, FAO

2
of 4
istanbul escort şişli escort tbilisi escort şişli escort şişli escort maslak escort istanbul escort beşiktaş escort taksim escort izmir escort ümraniye escort mecidiyeköy escort şişli escort taksim escort ümraniye escort kartal escort şirinevler escort maltepe escort istanbul escort ümraniye escort kadıköy escort vip escort mersin escort istanbul escorts ataköy escort avcılar escort beylikdüzü escort okmeydanı escort şişli escort tuzla escort işitme cihazı sex shop sex shop sex shop sex shop sex shop sex shop sex shop sex shop