Crop insurance schemes depend on two things

04.06.2010 1190 views
Crop insurance schemes depend on two things

René Gommes and Jürgen Grieser

Crop insurance schemes depend on two things: a relatively complex set of mathematical tools and reliable data on many different variables, ranging from weather to agricultural output. Insurance companies can protect farmers from harm, but they need reliable statistics which, all too often, are unavailable in developing countries.


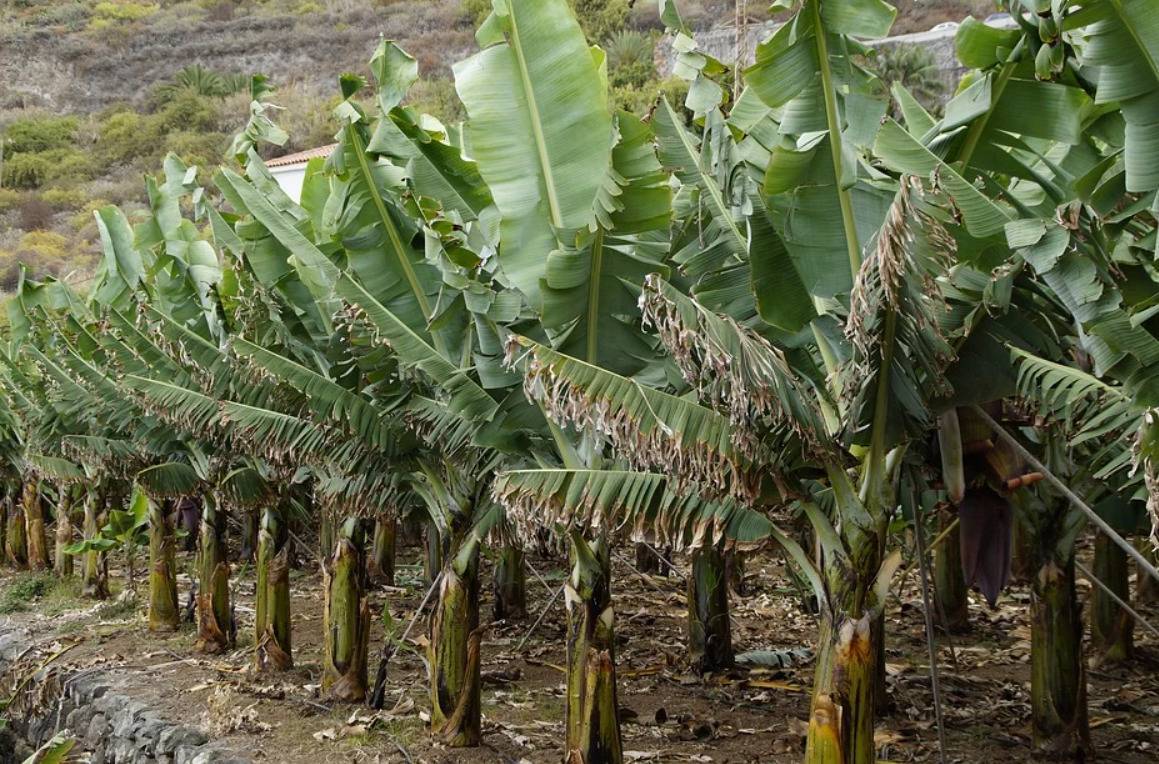
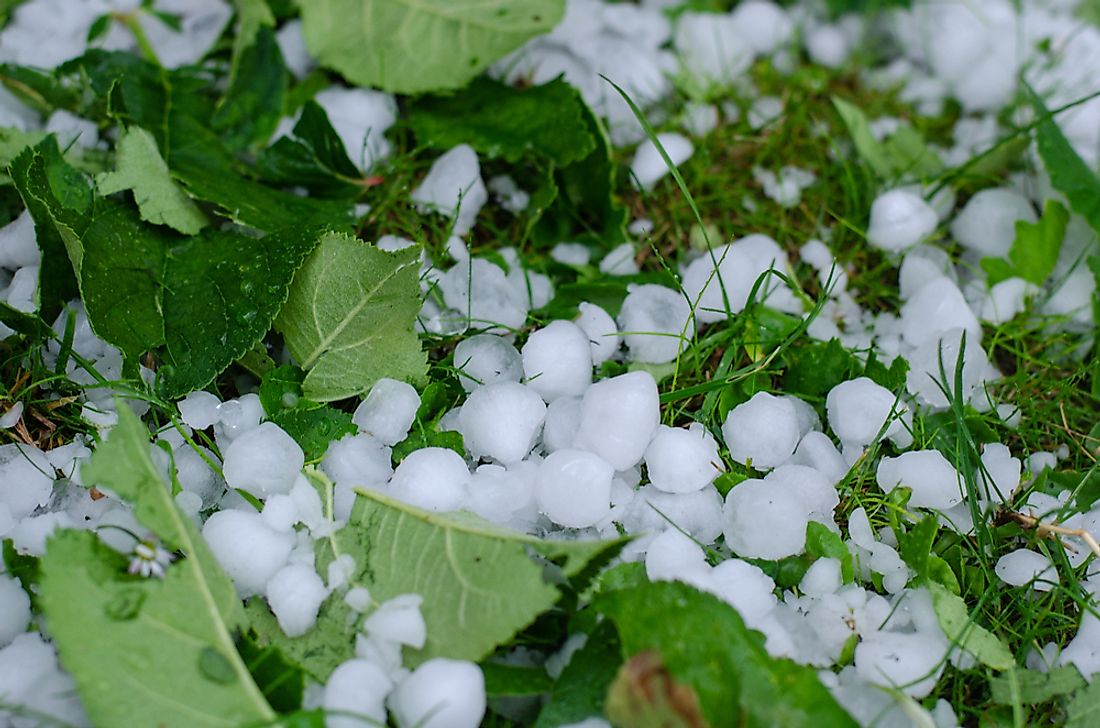
When a weather hazard hits a country, not all sectors of agriculture are affected in the same way. The vulnerability of crops differs from variety to variety. Some places are more vulnerable than others. Moreover, the growth stage matters too. Young crops are less vulnerable than mature crops, for instance. The impact of a storm thus depends not only on its force but also on the season and the varieties cultivated in the disaster area.


To assess risks adequately, insurers need data on the specific vulnerability of their clients’ crops as well as on the likeliness and strength of hazards. If insurance companies have reliable data and get the mathematic modelling right, they can spread risks over time and distribute them over many people. By collecting premiums and disbursing compensations, they can reduce the costs hazards inflict on clients and, at the same time, make a profit themselves. Obviously, the business model is quite challenging. Today, crop insurance schemes are well established in rich nations, but not so in developing countries. The estimated worldwide turnover of agricultural insurance (covering crops, livestock and forestry) amounted to ­$ 6.5 billion in 2001. North America and Europe ­accounted for 84 %, Africa accounted for only two per cent and Asia and Latin America for four per cent each. There are several reasons for crop insurance being less common in developing countries. The most important are: – Many farmers practice subsistence farming and generate only very little marketable surplus. Therefore, they are hardly integrated into the monetised economy. Insurance companies, however, are financial service providers, so they are geared to the monetised economy. Subsistence farms, moreover, tend to rely on many different varieties of plants and animals. That in itself reduces their exposure to risks, but it also makes it next to impossible to accurately assess their risks in financial terms. To reach the people, insurance companies need innovative approaches (“microinsurance”). – Hazards that affect crops tend to cover large areas, affecting many farmers at once. Droughts are the most common hazard. They impact entire regions, not only individual farms. Therefore, the damage they cause is large-scale even though the individual farms concerned may be quite small. Generally speaking, risks tend to be lower in regions of moderate climate. Food crops, moreover, are generally considered “low value crops”, so they are less appealing to insurance companies than cash crops like cotton or tobacco.Growing relevance In spite of such challenges, agricultural insurance is becoming ever more important in developing countries. This trend is driven by several factors, including the following:– The world’s population is growing, and so is the need for food. All available means must be used to protect people from food insecurity, and insurance certainly is an option. – Farmers all over the developing world are gradually adopting more commercial forms of agriculture. ­Accordingly, their dependence on international markets and market prices is growing, and so is the scope for insurance coverage. – Climate change implies that there will be more weather hazards. Agriculture will obviously be ­affected. – As foreign investors increasingly move into agriculture, their demand for insurance is growing too. – Governments consider insurance a healthy way to support their countries’ agriculture.There are several kinds of crop insurances (see box). Each has specific advantages and disadvantages. All insurance companies, however, tend to impose risk-reducing practices, such as the choice of planting dates or specific varieties that are resistant to disease or drought. Moreover, insurance companies depend on reliable data on weather, yields and related matters. The data must span enough time to be statistically relevant, but also be recent enough to relate to events that are likely to occur in the ongoing crop season. Typically, insurance companies need data from the past 15 years. Data bottlenecksFor several reasons, meteorological networks are not up to the job in many developing countries. Typically, national meteorological and hydrological services (NMHS) have adopted a commercial approach, so they don’t run weather stations in “remote” areas. These ­areas seem less important because of limited user ­requests and, accordingly, they generate lower revenue. Where the main customer of an NMHS is the aviation industry, the most reliable stations are located near airports, so there is relatively good data for major cities and their surroundings, but not for rural areas. Many countries, moreover, treat their meteorological data as confidential. In practice, urgently needed information on agricultural regions is often not available. Depressingly, meteorological networks have eroded in many countries since the colonial era. The main reason was that the economies were too weak to sustain this kind of public infrastructure. For many regions, the statistics of the 1960s are better than those of the past two decades. In other places, data have been lost for good. Climate change, however, means that recent data are becoming ever more important because it is impossible to extrapolate from long-ago experience.To some extent, indirect methods can substitute for direct meteorological observation. There has been good progress recently in computer simulation. Stochastic weather generators (SWGs) are programmes that deliver a large number of data. Satellite-based technology can also be of help. To be reliable, however, such information always needs to be calibrated against empirical ground data. Mathematical modellingTo design insurance schemes, providers typically use the mathematical tool of “yield functions”. These functions are derived from existing data. They provide models of how different kinds of weather impact farm yields. This is another area in which ample data are needed. So far, the insurance industry has not been able to calculate yield functions for all kinds of environments, crops and hazards. As is true of stochastic weather generators, it is always important to calibrate yield functions against empirical statistics. Generally speaking, yield data are more readily available than meteorological data. Most countries publish yield and production figures. A drawback, however, is that only few developing countries have reliable statistics at the regional and local levels. Governments use sampling schemes that are designed to provide reliable figures at the national level. Therefore, it is very difficult to do crop modelling at the level of a specific village or district. Doing so, however, would be useful to insurers.Mild and extreme hazardsMild hazards can mostly be modelled with standard tools because their impact is quite predictable. A mild drought, for instance, means that plants do not grow as big as they otherwise would, and yields go down ­accordingly. However, the plants are not physically damaged and some will be available for harvesting. Extreme weather hazards are much more difficult to model. They physically harm plants, and sometimes the entire crop is destroyed. In other cases, some plants recover. Most often, however, they are then affected by secondary pests and diseases. The probabilities of these events are much harder to assess than reduced growth is due to a moderate lack of water.Once again, assessment problems are compounded by the lack of data. Extreme weather only occurs rarely, so the statistical basis is weak. When disasters happen, moreover, people have other priorities than collecting crop data. Even agronomic research stations often discontinue observations after disasters, thereby losing precious reference data.To compute accurate yield functions, moreover, a host of data is relevant. Issues that need to be covered include: – irrigation,– fertilisers,– crop stages,– location as well as– pests and diseases.All information is needed near real-time and has to be calibrated against reference statistics. Once more, satellite observation can help, but only provides ancillary information which is not of much use unless there is sufficient ground data. ConclusionCrop insurance is an important way to protect small farmers from harm. However, the business model is complex. Schemes are only likely to work where there are fully operational meteorological services. At the national level, agricultural extension services are also likely to make a difference. In short, developing countries need comprehensive risk reduction packages.

================


Different kinds of crop insurances


The conventional crop insurance schemes that are prevalent in rich nations are called damage-based insurance or multi-peril crop insurance. Basically, a farmer agrees with an insurer that compensation will be given if the farm’s yield or income drops below a certain level. If this happens, the insurer verifies that the farmer’s claim is justified before disbursing any money. This process is labour-intensive and expensive. Therefore, this kind of insurance is more common for high-value crops (like grapes and other fruits) than for field crops (like wheat or potatoes). The main advantage of this kind of insurance is that it can be tailored to indi­vidual needs.Index-based insurance (IBI) is a different model that has recently been used in developing countries. IBI schemes are about insurers paying compensations to clients when an agreed threshold of a specific index is exceeded. The index can relate to wind speed, for instance (hurricane insurance). Other options are minimum and maximum temperatures or levels of rainfall in pre-defined time spans. IBI, however, is only viable where there is a reliable network of meteorological stations. Moreover, there has to be sufficient farm data to estimate risks accurately. Obviously, index definition is crucial to IBI success. The index must relate directly to the insured product. Insurers, therefore, need a precise understanding of what impact a certain kind of event has on the yield of a specific crop. Otherwise, it is impossible to design insurance policies that cover farmers’ actual risks. Any mismatch, however, would either mean excessive premium payments on the side of the farmers or losses on the side of the insurer. Either way, the viability of the scheme would be undermined. The major advantage of IBI is that insurers do not have to check whether clients actually suffer losses, so administration costs are reduced. Accordingly, premiums are lower too. In principle, IBI insurances are more suitable to cover subsistance farmers than conventional crop insurances. Furthermore, complex IBI schemes can involve other economic sectors that are affected by weather – tourism for instance. The more clients an insurance company has, the wider it can spread the risk and the more attractive its policies become.

25.10.2022

A Practical Method for Adjusting the Premium Rates in Crop-Hail Insurance with Short-Term Insurance Data

The frequency of hailstorms is generally low in small geographic areas. In other words, it may be very likely that hailstorm occurrences will vary between neighboring locations within a short period of time. Besides, a newly launched insurance scheme lacks the data. It is, therefore, difficult to sustain a sound insurance program under these circumstances, with premium rates based on meteorological data without a complimentary adjustment process.

18.10.2019

Malta - Vegetable production dropped 7% in 2018

Last year, Malta’s local vegetable produce dropped by 7% when compared to the previous year. The total vegetables produced in tonnes amounted to 58,178, down by 7% when compared to 2017. Their value too diminished as the total produce was valued at €30 million, down by 13% over the previous year. The most significant drop was in potatoes, down by 27% over the previous year. Tomatoes and onions were the only vegetables to have increased in volume, by 3% and 4% respectively but their value diminished by 9% and 24% respectively. The figures were published by the National Statistics Office on the event of World Food Day 2019, which will be celebrated on Wednesday. Cauliflower, cabbage and lettuce produce dropped by 10%, 3%, and 12% respectively. In the realm of local fruit, a drop of produce was registered here too apart from strawberries, which experienced a whopping increase of 58% over 2017. Total fruit produced in 2018 amounted to 13,057 tonnes, down by 1% when compared to 2017. The total produce was valued at €10 million, a 3% increase in value. Peaches produced were down by 35% and the 376 tonnes of peaches cultivated amounted to €0.5 million in value. Orange produce dropped by 10% and lemon produce dropped by 14%. There was no change in the amount of grapes produced and the 3,642 tonnes of grapes produced in 2018 were valued at €2.3 million. 70% of fruit and vegetables consumed in Malta is imported. The drop in local produce could be the result of deleterious or unsuitable weather patterns. Source - https://www.freshplaza.com

07.10.2019

USA - Greenhouse tomato production spans most states

While Florida and California accounted for 76 percent of U.S. production of field-grown tomatoes in 2016, greenhouse production and use of other protected-culture technologies help extend the growing season and make production feasible in a wider variety of geographic locations. Some greenhouse production is clustered in traditional field-grown-tomato-producing States like California. However, high concentrations of greenhouses are also located in Nebraska, Minnesota, New York, and other States that are not traditional market leaders. Among the benefits that greenhouse tomato producers can realize are greater market access both in the off-season and in northern retail produce markets, better product consistency, and improved yields. These benefits make greenhouse tomato production an increasingly attractive alternative to field production despite higher production costs. In addition to domestic production, a significant share of U.S. consumption of greenhouse tomatoes is satisfied by imports. In 2004, U.S., Mexican, and Canadian growers each contributed about 300 million pounds of greenhouse tomatoes annually to the U.S. fresh tomato market. Since then, Mexico’s share of the greenhouse tomato market has grown sharply, accounting for almost 84 percent (1.8 billion pounds) of the greenhouse volume coming into the U.S. market. Source - https://www.freshplaza.com

03.10.2019

World cherry production will decrease to 3.6 million tons

According to information from the USDA for the 2019-2020 season, world cherry production is expected to decrease slightly and amount to 3.6 million tons. This decline is due to the damages that the weather caused on cherry crops in the European Union. Even though Chile is expected to achieve a record export, world trade in cherries is expected to drop to 454,000 tons, based on lower shipments from Uzbekistan and the US. Turkey Turkey's production is expected to increase to 865,000. As a result of the strong export demand, producers continue to invest and improve their orchards, switching to high yield varieties and gradually expanding the surface for sweet cherries. More supplies are expected to increase exports to a record 78,000 tons, continuing its long upward trend. Chile Chile's production is forecast to increase from 30,000 tons to 231,000 as they have a larger area of mature trees. Between 2009/10 and 2018/19, the crop area has almost tripled, a trend that is expected to continue. The country is expected to export up to 205,000 tons in higher supplies. The percentage of exports destined for China has increased from 13 to almost 90% since 2009/10. China China's production is expected to increase by up to 24% and to amount to 420,000 tons, due to the recovery of the orchards that were damaged by frost last year. In addition, there are new crops that will go into production. Imports are expected to increase by 15,000 tons and to stand at 195,000 tons, as the increase in supplies from Chile will more than compensate for the lower shipments from the United States. Although higher tariffs are maintained for American cherries, the United States is expected to remain China's main supplier in the northern hemisphere. United States US production is expected to remain stable at 450,000 tons. Imports are expected to increase to 18,000 tons with more supplies available from Chile. Exports are forecast to decrease for the second consecutive year to 80,000 tons, as high retaliatory tariffs continue to suppress US shipments to China. If this happens, it will be the first time that US cherry exports experience a decrease in 2 consecutive years since 2002/03, when production suffered a fall of 44%. European Union EU production is projected to fall by more than 20%, remaining at 648,000 tons because of the hail that affected the early varieties in Italy, and the frost, low temperatures, and drought that caused a significant loss of fruit in Poland, the main producer. Lower supplies are expected to pressure exports to 15,000 tons and increase imports to 55,000 tons. Russia Russia's imports are expected to contract by 13,000 tons to 80,000 with lower supplies from Kazakhstan, Moldova, and Serbia. Source - https://www.freshplaza.com

09.08.2019

EU - 20% fewer apples and 14% fewer pears than last year

This year's European apple production is expected to come to 10,556,000 tons. That is 20% less than last year. It is also 8% less than the average over the past three years. The European pear harvest is expected to be 2,047,000 tons. This is 14% lower than last year and 9% less than the previous three seasons average. These figures are according to the World Apple and Pear Association, WAPA's top fruit prognoses. They presented their report at Prognosfruit this morning. Apple harvest per country Poland is Europe's apple-growing giant. This country is expected to process 44% fewer apples. The yield is expected to be 2,710,000 tons. Last year, this was still 4,810,000 tons. In Italy, yields are only three percent lower than last year. According to WAPA, this country will have an apple harvest of 2,195,000 tons. France takes third place. They will even have 12% more apples than last year to process - 1,652,000 tons. Pear harvest per country With 511,000 tons, Italy's pear harvest is much lower than last year. It has dropped by 30%. In terms of the average over the previous three seasons, this fruit's yield is 29% lower. In the Netherlands, the pear harvest is expected to be six percent lower, at 379,000 tons. This volume is still 3% more than the average over the last three years. Belgium has 10% fewer pears (331,000 tons) than last year. They are just ahead of Spain. With 311,000 tons, Spain who will harvest four percent more pears. Apple harvest per variety The Golden Delicious remains, by far, the largest apple variety in Europe. It is expected that 2,327,000 tons of these apples will be harvested this year. This is three percent less than last year. At 1,467,000 tons, Gala estimations are exactly the same as last year. The European Elstar harvest will also be roughly equivalent to last year. A volume of 355,000 tons of this variety is expected. Pear harvest per variety Looking at the different varieties, the European Conference is estimated to be 8% lower than last year. A volume of 910,000 tons is expected. The low Italian pear estimate will result in 34% fewer Abate Fetel pears (211,000 tons) being available. This is according to WAPA's estimate. This makes this variety smaller than the Williams BC (230.000 ton) in Europe. Source - https://www.freshplaza.com

30.01.2018

Spring frost losses and climate change not a contradiction in terms - Munich Re

Between 17 April and 10 May 2017, large parts of Europe were hit by a cold snap that brought a series of overnight frosts. As the budding process was already well advanced due to an exceptionally warm spring, losses reached historic levels – particularly for fruit and wine growers: economic losses are estimated at €3.3bn, with around €600m of this insured. In the second and third ten-day periods of April, and in some cases even over the first ten days of May 2017, western, central, southern and eastern Europe experienced a series of frosty nights, with catastrophic consequences in many places for fruit growing and viticulture. The worst-affected countries were Italy, France, Germany, Poland, Spain and Switzerland. Losses were so high because vegetation was already well advanced following an exceptionally warm spell of weather in March that continued into the early part of April. For example, the average date of apple flowering in 2017 for Germany as a whole was 20 April, seven days earlier than the average for the period 1992 to 2016. In many parts of Germany, including the Lake Constance fruit-growing region, it even began before 15 April. In the case of cherry trees – whose average flowering date in Germany in 2017 was 6 April – it was as much as twelve days earlier than the long-term average. The frost had a devastating impact because of the early start of the growing season in many parts of Europe. In the second half of April, it affected the sensitive blossoms, the initial fruiting stages and the first frost-susceptible shoots on vines. Meteorological conditions The weather conditions that accounted for the frosty nights are a typical feature of April, and also the reason for the month’s proverbial reputation for changeable weather. The corridor of fast-moving upper air flow, also known as the polar front, forms in such a way that it moves in over central Europe from northwesterly directions near Iceland. This north or northwest pattern frequently occurs if there is high air pressure over the eastern part of the North Atlantic, and lower air pressure over the Baltic and the northwest of Russia. Repeated low-pressure areas move along this corridor towards Europe, bringing moist and cold air masses behind their cold fronts from the areas of Greenland and Iceland. Occasionally, the high-pressure area can extend far over the continent in an easterly direction. The flow then brings dry, cold air to central Europe from high continental latitudes moving in a clockwise direction around the high. It was precisely this set of weather conditions with its higher probability of overnight frost that dominated from mid-April to the end of the month. There were frosts with temperatures falling below –5°C, in particular from 17 to 24 April (second and third ten-day periods of April), and even into the first ten-day period of May in eastern Europe. The map in Fig. 2 shows the areas that experienced night-time temperatures of –2°C and below in April/May. High losses in fruit and wine growing Frost damage to plants comes from intracellular ice formation. The cell walls collapse and the plant mass then dries out. The loss pattern is therefore similar to what is seen after a drought. Agricultural crops are at varying risk from frost in the different phases of growth. They are especially sensitive during flowering and shortly after budding, as was the case with fruit and vines in April 2017 due to the early onset of the growing season. That was why the losses were so exceptionally high in this instance. In Spain, the cold snap also affected cereals, which were already flowering by this date. Even risk experts were surprised at the geographic extent and scale of the losses (overall losses: €3.3bn, insured losses: approximately €600m). Overall losses were highest in Italy and France, with figures of approximately a billion euros recorded in each country. Two basic concepts for frost insurance As frost has always been considered a destructive natural peril for fruit and wine growing and horticulture, preventive measures are widespread. In horticulture, for example, plants are cultivated in greenhouses or under covers, while in fruit growing, frost-protection measures include the use of sprinkler irrigation as well as wind machines or helicopters to mix the air layers. Just how effective these methods prove to be will depend on meteorological conditions, which is precisely why risk transfer is so important in this sector. There are significant differences between one country and the next in terms of insurability and insurance solutions. But essentially there are two basic concepts available for frost insurance: indemnity insurance, where hail cover is extended to include frost or other perils yield guarantee insurance covering all natural perils In most countries, the government subsidises insurance premiums, which means that insurance penetration is higher. In Germany, where premiums are not subsidised and frost insurance density is low, individual federal states like Bavaria and Baden-Württemberg have committed to providing aid to farms that have suffered losses – including aid for insurable crops such as wine grapes and strawberries. Late frosts and climate change There are very clear indications that climate change is bringing forward both the start of the vegetation period and the date of the last spring frost. Whether the spring frost hazard increases or decreases with climate change depends on which of the two occurs earlier. There is thus a race between these two processes: if the vegetation period in any given region begins increasingly earlier compared with the date of the last spring frost, the hazard will increase over the long term. If the opposite is the case, the hazard diminishes. Because of the different climate zones in Europe, the race between these processes is likely to vary considerably. Whereas the east is more heavily influenced by the continental climate, regions close to the Atlantic coastline in the west enjoy a much milder spring. A study has shown that climate change is likely to significantly reduce the spring frost risk in viticulture in Luxembourg along the River Moselle1. The number of years with spring frost between 2021 and 2050 is expected to be 40% lower than in the period 1961 to 1990. By contrast, a study on fruit-growing regions in Germany2 concluded that all areas will see an increase in the number of days with spring frost, especially the Lake Constance region, where reduced yields are projected until the end of this century. At the same time, however, only a few preliminary studies have been carried out on this subject, so uncertainty prevails. Outlook The spring frost in 2017 illustrated the scale that such an event can assume, and just how high losses in fruit growing and viticulture can be. Because the period of vegetation is starting earlier and earlier in the year as a result of climate change, spring frost losses could increase in the future, assuming the last spring frost is not similarly early. It is reasonable to assume that these developments will be highly localised, depending on whether the climate is continental or maritime, and whether a location is at altitude or in a valley. Regional studies with projections based on climate models are still in short supply and at an early stage of research. However, one first important finding is that the projected decrease in days with spring frost does not in any way imply a reduction in the agricultural spring frost risk for a region. So spring frosts could well result in greater fluctuations in agricultural yields. In addition to preventive measures, such as the use of fleece covers at night, sprinkler irrigation and the deployment of wind machines, it will therefore be essential to supplement risk management in fruit growing and viticulture with crop insurance that covers all natural perils. Source - ttps://www.munichre.com/

17.05.2014

Russia Livestock Overview: Cattle, Swine, Sheep & Goats

Private plots generate 48 percent of cattle, 43 percent of swine and 54 percent of sheep and goats in Russia.  The Russian government recently approved a new program that will succeed the National Priority Project in agriculture (NPP) titled, “TheState Program for Development of Agriculture and Regulation of Food and Agricultural Markets in 2008-2012,” that encourages pork and beef production and attempts to address Russia’s declining cattle numbers.  This program includes import-substitution policies designed to stimulate domestic livestock production and to protect local producers. In the beginning of 2007, the economic environment for swine production was generally unfavorable.  The average production cost was RUR40-45/kilo of live weight, while the farm gate price was RUR40/kilo live weight.  Pork producers have been expressing concern for years about sales after implementation of the NPP as pork consumption is growing at a slower rate than pork production.  As a result, the pork sector has been lobbying the Russian government to regulate imports in spite of the meat TRQ agreement. From January-September 2007, 1.38 million metric tons (MMT) of red meat was imported.  A 12-year decline in beef production has resulted in limited beef availability in the Russian market leading to a spike in prices.  In response, the Russian government has been force to take steps to increase the availability of beef by lifting a meat ban on Poland and by looking to Latin America for higher volumes of product.  Feed stocks decreased during the first 11 months of 2007 compared to the previous year which will likely create even greater financial problems for livestock operations in 2008 as feed prices continue to skyrocket.  Grain prices increased rapidly in Russia through the middle of July 2007 before stabilizing at high levels as harvest progress reports were released. The Russian pig crop is expected to increase by 6 percent in 2008, while cattle herds are predicted to decrease by 3.5 percent.  Some meat market analysts predict that by 2012, as new and modernized pig farming complexes reach planned capacity, pork production could reach 3.5 MMT – up 75 percent from 2008 estimates. According to the Russian Statistics Agency (Rosstat), 1/3 of all Russian “large farms” are unprofitable.  Many of these are involved in livestock production.  Small, inefficient producers are uncompetitive and have already begun disappearing from the market. The Russian veterinary service continues to playa decisive role in meat import supply management. Source - http://www.cattlenetwork.com

27.11.2012

Statistics Canada : Farm income, 2011

Realized net income for Canadian farmers amounted to $5.7 billion in 2011, a 53.1% increase from 2010. This rise followed a 19.0% increase in 2010 and a 19.6% decline in 2009. Realized income is the difference between a farmer's cash receipts and operating expenses, minus depreciation, plus income in kind. Realized net income fell in four provinces: Newfoundland and Labrador, Nova Scotia, Manitoba and British Columbia. In each, increases in costs outpaced gains in receipts. Farm cash receipts Farm cash receipts, which include market receipts from crop and livestock sales as well as program payments, rose 11.9% to $49.8 billion in 2011. This was the first increase since 2008. Market receipts alone increased 12.0% to $46.3 billion. Crop receipts, which increased 15.8% to $25.9 billion, contributed the most to the increase. Sales from livestock products rose 7.5% to $20.3 billion, the largest annual increase since 2005. Stronger prices for grains and oilseeds played a major role in the increase in crop revenues. For example, canola receipts increased 37.3% in 2011 on the strength of a 27.3% gain in prices. Grains and oilseed prices started rising in the last half of 2010 as a result of limited global stocks and strong demand. Even though prices peaked in mid-2011, prices for the year, on average, remained well above 2010 levels. Crop receipts rose in every province except Manitoba and Newfoundland and Labrador. In Manitoba, difficult growing conditions reduced marketings of most grains and oilseeds. In Prince Edward Island and New Brunswick, increases in potato prices and marketings helped push crop receipts higher. It was also stronger prices that were behind the rise in livestock receipts. Hog receipts increased 15.5% to $3.9 billion on the strength of a 14.7% price increase. Cattle prices rose 19.5% in 2011, while receipts increased 1.1% because of a reduced supply of market animals. Hog, cattle and calf prices increased in 2010. The upward trend continued throughout most of 2011, primarily because of low North American inventories and high feed grain costs. Receipts for producers in the three supply-managed sectors-dairy, poultry and eggs-increased 7.9% as rising prices reflected higher costs for feed grain and other production inputs. A 14.9% rise in chicken receipts exceeded increases for eggs (+8.7%) and dairy products (+5.3%). Program payments increased 11.2% to $3.5 billion in 2011. Increases in Quebec provincial stabilization payments as well as crop insurance payments in Manitoba and Saskatchewan accounted for much of the rise. Farm expenses Farm operating expenses (after rebates) were up 8.4% to $38.3 billion in 2011, the second-largest percentage increase since 1981. This increase followed two consecutive years of modest declines. Higher prices for fertilizer, feed and machinery fuel contributed to the increase in operating expenses. According to the Farm Input Price Index, both fertilizer and machinery fuel prices were up by over 25% in 2011. At the same time, feed grain prices increased by more than 30%. When depreciation charges were included, total farm expenses increased 8.2% to $44.1 billion. Depreciation costs rose 6.9%. Total farm expenses advanced in every province in 2011. The largest percentage increases occurred in Saskatchewan (+12.3%), Quebec (+9.5%) and Alberta (+9.0%). Total net income Total net income reached $5.8 billion, a $3.3 billion gain. There were large increases in Saskatchewan (+$2.1 billion), Alberta (+$567 million) and Ontario (+$470 million), while Newfoundland and Labrador, New Brunswick and Manitoba saw declines. Total net income adjusts realized net income for changes in farmer-owned inventories of crops and livestock. It represents the return to owner's equity, unpaid labour, and management and risk. The total value of farm-owned inventories rose by $165 million in 2011. A strong increase in deferred grain payments together with the first increase in cattle inventories since 2004 contributed to the rise. Note to readersRealized net income can vary widely from farm to farm because of several factors, including commodities, prices, weather and economies of scale. This and other aggregate measures of farm income are calculated on a provincial basis employing the same concepts used in measuring the performance of the overall Canadian economy. They are a measure of farm business income, not farm household income. Financial data for 2011 collected at the individual farm business level using surveys and other administrative sources will soon be tabulated and made available. These data will help explain differences in performance of various types and sizes of farms. For details on farm cash receipts for the first three quarters of 2012, see today's "Farm cash receipts" release. As a result of the release of data from the 2011 Census of Agriculture on May 10, 2012, data on farm cash receipts, operating expenses, net income, capital value and other data contained in the Agriculture Economic Statistics series are being revised, where necessary. The complete set of revisions will be released in the November 26, 2013, edition of The Daily. Table 1 Net farm income 2009 2010r 2011p 2009 to 2010 2010 to 2011 millions of dollars % change + Total farm cash receipts including payments 44,599 44,466 49,772 -0.3 11.9 - Total operating expenses after rebates 36,052 35,315 38,276 -2.0 8.4 = Net cash income 8,547 9,151 11,496 7.1 25.6 + Income-in-kind 39 40 45 2.6 11.1 - Depreciation 5,471 5,483 5,864 0.2 6.9 = Realized net income 3,115 3,709 5,677 19.0 53.1 + Value of inventory change -281 -1,157 165 ... ... = Total net income 2,834 2,551 5,842 ... ... Table 2 Net farm income, by province Canada Newfoundland and Labrador Prince Edward Island Nova Scotia New Brunswick Quebec millions of dollars 2010r + Total farm cash receipts including payments 44,466 118 407 500 479 7,171 - Total operating expenses after rebates 35,315 106 367 422 406 5,472 = Net cash income 9,151 12 41 78 73 1,699 + Income-in-kind 40 0 0 1 1 10 - Depreciation 5,483 8 41 59 54 727 = Realized net income 3,709 4 0 19 20 983 + Value of inventory change -1,157 -0 18 0 9 13 = Total net income 2,551 4 18 19 29 996 2011p + Total farm cash receipts including payments 49,772 120 477 527 533 7,967 - Total operating expenses after rebates 38,276 114 391 448 424 6,018 = Net cash income 11,496 6 86 79 109 1,949 + Income-in-kind 45 0 0 1 1 11 - Depreciation 5,864 9 43 62 55 767 = Realized net income 5,677 -2 43 18 55 1,194 + Value of inventory change 165 -0 -12 2 -50 -24 = Total net income 5,842 -3 31 20 5 1,170 Source - http://www.4-traders.com/

istanbul escort şişli escort tbilisi escort şişli escort şişli escort maslak escort istanbul escort beşiktaş escort taksim escort izmir escort ümraniye escort mecidiyeköy escort şişli escort taksim escort ümraniye escort kartal escort şirinevler escort maltepe escort istanbul escort ümraniye escort kadıköy escort vip escort mersin escort istanbul escorts ataköy escort avcılar escort beylikdüzü escort okmeydanı escort şişli escort tuzla escort işitme cihazı sex shop sex shop sex shop sex shop sex shop sex shop sex shop sex shop