The key agri-insurance data are given in the table below.
Table: Crop insurance data by crop
|
Crop |
Contracts |
Including, collateral agreements |
Acreage, hectares |
Insured sum, UAH |
Premiums, UAH |
|
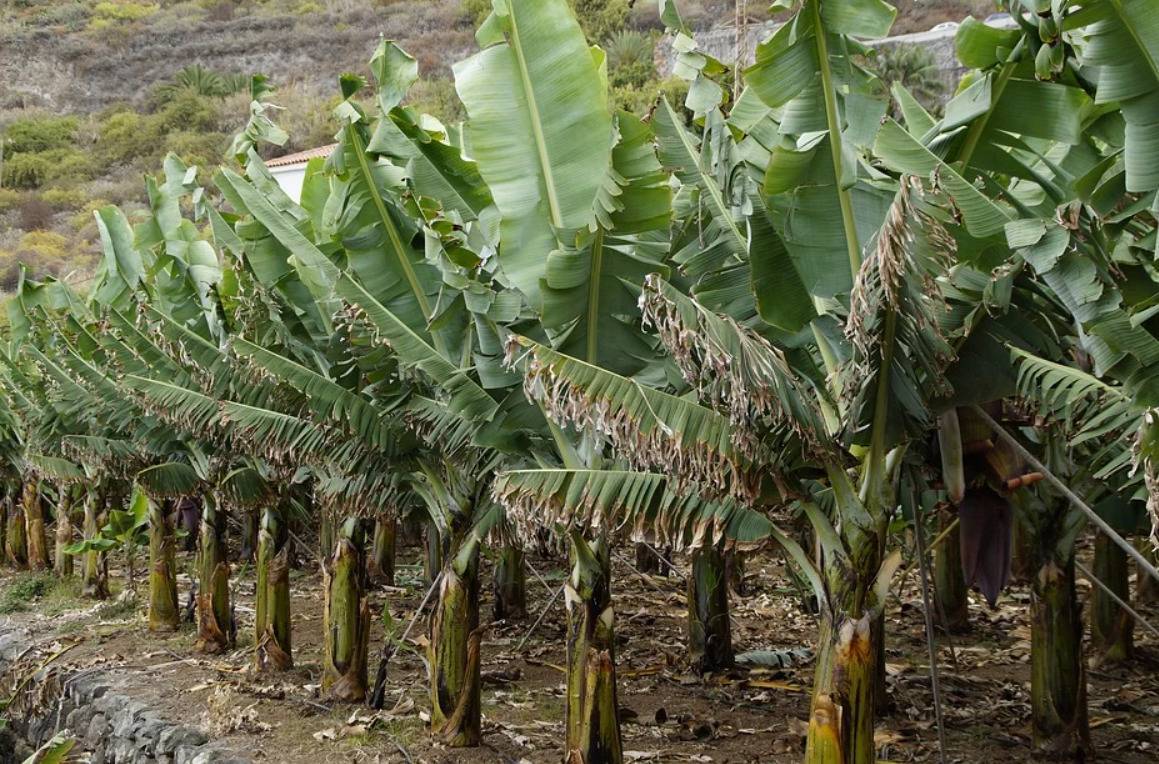
Winter wheat |
1,091 |
42 |
284,156 |
1,431,197,640 |
44,356,435 |
|
Winter barley |
39 |
9 |
9,136 |
21,520,785 |
348,608 |
|
Winter rye |
122 |
1 |
13,317 |
38,726,205 |
1,430,316 |
|
Winter triticale |
2 |
2 |
380 |
1,368,360 |
13,478 |
|
Winter rapeseed |
31 |
15 |
12,060 |
65,866,904 |
1,011,434 |
|
Wheat |
6 |
0 |
1,890 |
9,335,331 |
154,280 |
|
Barley |
88 |
1 |
21,078 |
64,027,285 |
3,359,356 |
|
Rye |
1 |
0 |
9,854 |
30,765,013 |
1,155,223 |
|
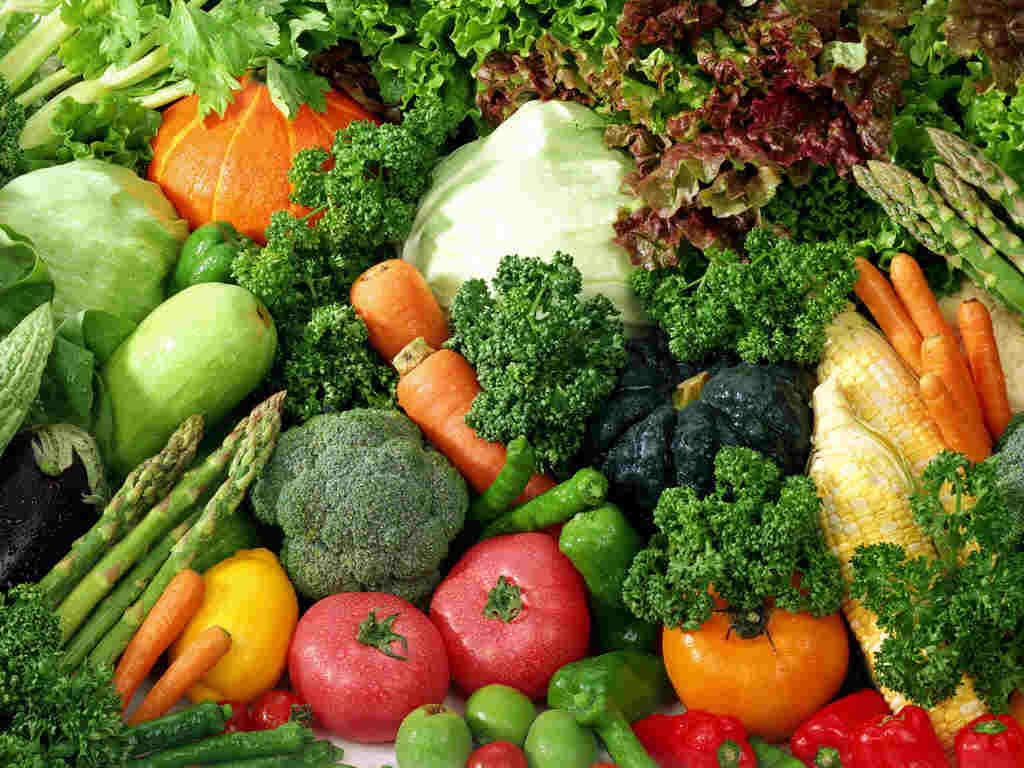
Sugar beets |
234 |
3 |
55,845 |
735,329,840 |
26,803,363 |
|
Sunflower |
98 |
5 |
40,137 |
161,813,125 |
4,749,494 |
|
Rapeseed |
2 |
0 |
254 |
1,168,146 |
165,877 |
|
Bea |
1 |
0 |
32 |
70,144 |
905 |
|
Soya |
54 |
1 |
19,615 |
84,895,368 |
3,928,492 |
|
Vegetables |
1 |
0 |
11 |
512,050 |
8,193 |
|
Corn |
192 |
4 |
69,490 |
495,640,697 |
19,339,792 |
|
Spring mustard |
2 |
0 |
627 |
526,879 |
23,595 |
|
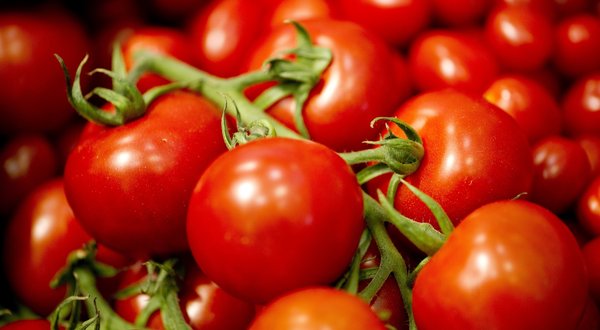
Tomatoes |
1 |
0 |
663 |
18,332,454 |
696,633 |
|
Chick pea |
2 |
0 |
22 |
125,104 |
2,551 |
|
Buck wheat |
13 |
0 |
1,140 |
31,855,050 |
318,124 |
|
Rice |
1 |
0 |
352 |
6,588,000 |
197,640 |
|
Total |
1,981 |
83 |
540,057 |
3,199,664,378 |
108,063,789 |
Table: Average premium rates, average insured sums, indemnities and average rates per crop
|
Crop |
Average premium rate |
Acreage hectares per contracts |
Premium total, UAH per contract |
Premium sum, UAH per hectare |
Insured sum per hectare |
|
Winter wheat |
3.10% |
260 |
40,657 |
156 |
5,037 |
|
Winter barley |
1.62% |
234 |
8,939 |
38 |
2,356 |
|
Winter rye |
3.69% |
109 |
11,724 |
107 |
2,908 |
|
Winter triticale |
0.99% |
190 |
6,739 |
35 |
3,600 |
|
Winter rapeseed |
1.54% |
389 |
32,627 |
84 |
5,462 |
|
Wheat |
1.65% |
315 |
25,713 |
82 |
4,939 |
|
Barley |
5.25% |
240 |
38,174 |
159 |
3,038 |
|
Rye |
3.75% |
9,854 |
1,155,223 |
117 |
3,122 |
|
Sugar beets |
3.65% |
239 |
114,544 |
480 |
13,167 |
|
Sunflower |
2.94% |
410 |
48,464 |
118 |
4,032 |
|
Rapeseed |
14.20% |
127 |
82,938 |
653 |
4,599 |
|
Bea |
1.29% |
32 |
905 |
28 |
2,192 |
|
Soya |
4.63% |
363 |
72,750 |
200 |
4,328 |
|
Vegetables |
1.60% |
11 |
8,193 |
745 |
46,550 |
|
Corn |
3.90% |
362 |
100,728 |
278 |
7,133 |
|
Spring mustard |
4.48% |
314 |
11,798 |
38 |
840 |
|
Tomatoes |
3.80% |
663 |
696,633 |
1051 |
27,660 |
|
Chick pea |
2.04% |
11 |
1,276 |
116 |
5,687 |
|
Buck wheat |
1.00% |
88 |
24,471 |
279 |
27,952 |
|
Rice |
3.00% |
352 |
197,640 |
561 |
18,716 |
|
Average |
3.38% |
273 |
54,550 |
200 |
5,925 |
Table: agri-insurance by oblast
|
Oblast |
Contracts |
Total acreage, hectares |
Sum insured, UAH |
Premiums, UAH |
|
Crimea Autonomous Republic |
57 |
16,530 |
62,490,177 |
2,094,670 |
|
Vinnytsya |
146 |
46,811 |
395,480,909 |
6,880,688 |
|
Volyn |
32 |
6,314 |
35,441,029 |
950,265 |
|
Dniepropetrovsk |
76 |
22,873 |
75,646,089 |
1,864,920 |
|
Donetsk |
60 |
12,224 |
51,997,934 |
1,477,373 |
|
Zhytomyr |
102 |
18,440 |
109,738,929 |
4,467,712 |
|
Zakarpattya |
5 |
700 |
5,626,795 |
422,145 |
|
Zaporizhzhya |
26 |
10,965 |
51,435,588 |
1,542,322 |
|
Ivano-Frankivsk |
24 |
4,249 |
28,764,906 |
1,075,829 |
|
Kyiv |
89 |
15,349 |
96,631,725 |
3,349,294 |
|
Kirovograd |
84 |
29,083 |
144,442,608 |
4,500,355 |
|
Lugansk |
64 |
13,535 |
41,212,761 |
1,155,739 |
|
Lviv |
37 |
22,656 |
114,083,087 |
3,745,327 |
|
Mykolaiv |
82 |
15,485 |
87,389,454 |
3,587,329 |
|
Odessa |
103 |
19,773 |
139,691,985 |
2,558,958 |
|
Poltava |
382 |
96,056 |
749,965,702 |
34,164,297 |
|
Rivne |
34 |
14,497 |
101,459,633 |
2,033,981 |
|
Sumy |
84 |
30,645 |
136,901,330 |
3,126,327 |
|
Ternopil |
68 |
15,883 |
94,081,477 |
3,238,702 |
|
Kharkiv |
73 |
20,608 |
105,712,615 |
3,942,607 |
|
Kherson |
56 |
36,576 |
128,827,595 |
4,123,570 |
|
Khmel’nytsk |
158 |
37,320 |
260,929,735 |
11,627,662 |
|
Cherkassy |
54 |
14,957 |
89,768,606 |
2,459,782 |
|
Chernivtsi |
12 |
1,759 |
6,174,076 |
251,604 |
|
Chernigiv |
73 |
16,771 |
85,769,635 |
3,422,333 |
|
Total |
1,981 |
540,057 |
3,199,664,378 |
108,063,789 |
The average premium rate throughout 2011 spring-autumn was 3.38%. At the same time, only in four oblasts the average rate per oblast was over 4%. Thus in Zhytomyr oblast the average rate was 4.07% (4.1% in Mykolaiv oblast, 4,56% in Poltava oblast and 4.46% in Khmal’nytsk oblast). The lowest rates were applied in the oblasts of Vinnytsya (1.74%), Odesa (1.83%) and Rivne (2%).
The average contract insured 273 hectares. The average premium per acreage unit (hectare) was UAH 200. The lowest average premiums were paid in the oblasts of Dniepropetrovsk (UAH 82) and Lugansk (UAH 85). Agri-insurance was most costly in the oblasts of Poltava (UAH 356) and Khmel’nytsk (UAH 312). The table below illustrates the other major indicators.
Table: Agri-insurance by oblast
|
Oblast |
Average premium rate |
Acreage, hectares per contract |
Premium per contract, UAH |
Premium per acreage unit, UAH/hectare |
|
Crimea Autonomous Republic |
3.35% |
290 |
36749 |
127 |
|
Vinnytsya |
1.74% |
321 |
47128 |
147 |
|
Volyn |
2.68% |
197 |
29696 |
151 |
|
Dniepropetrovsk |
2.47% |
301 |
24538 |
82 |
|
Donetsk |
2.84% |
204 |
24623 |
121 |
|
Zhytomyr |
4.07% |
181 |
43801 |
242 |
|
Zakarpattya |
7.50% |
140 |
84429 |
603 |
|
Zaporizhzhya |
3.00% |
422 |
59320 |
141 |
|
Ivano-Frankivsk |
3.74% |
177 |
44826 |
253 |
|
Kyiv |
3.47% |
172 |
37633 |
218 |
|
Kirovograd |
3.12% |
346 |
53576 |
155 |
|
Lugansk |
2.80% |
211 |
18058 |
85 |
|
Lviv |
3.28% |
612 |
101225 |
165 |
|
Mykolaiv |
4.10% |
189 |
43748 |
232 |
|
Odessa |
1.83% |
192 |
24844 |
129 |
|
Poltava |
4.56% |
251 |
89435 |
356 |
|
Rivne |
2.00% |
426 |
59823 |
140 |
|
Sumy |
2.28% |
365 |
37218 |
102 |
|
Ternopil |
3.44% |
234 |
47628 |
204 |
|
Kharkiv |
3.73% |
282 |
54008 |
191 |
|
Kherson |
3.20% |
653 |
73635 |
113 |
|
Khmel’nytsk |
4.46% |
236 |
73593 |
312 |
|
Cherkassy |
2.74% |
277 |
45552 |
164 |
|
Chernivtsi |
4.08% |
147 |
20967 |
143 |
|
Chernigiv |
3.99% |
230 |
46881 |
204 |
|
Average |
3.38% |
273 |
54550 |
200 |
Table: the insurers’ shares by a range of indicators
|
Contracts, % |
Total sum insured for the group,% |
Premiums collected, % |
Acreage insured, % |
Premium rate per group |
|
|
Market leaders |
89 |
74 |
74 |
73 |
4.05% |
|
Group II |
10 |
23 |
24 |
25 |
1.54% |
|
Group III |
1 |
2 |
2 |
2 |
0.48% |
Table: Aggregated data by insurance provider for spring-autumn 2011
|
Company |
Contracts |
Sum insured, UAH |
Premiums, UAH |
Total acreage, hectares |
Average premium rate |
|
ASKA-DS |
7 |
9,538,566 |
83,026 |
2,100 |
0.87% |
|
INGO-Ukraine |
43 |
409,696,116 |
2,853,931 |
55,277 |
0.70% |
|
UPSK |
16 |
65,786,531 |
267,147 |
8,507 |
0.41% |
|
TAS |
41 |
86,421,252 |
958,933 |
14,711 |
1.11% |
|
Провидна |
868 |
925,779,689 |
34,205,405 |
176,851 |
3.69% |
|
Providna |
37 |
38,876,620 |
1,003,521 |
14,742 |
2.58% |
|
Oranta-Sich |
2 |
2,353,680 |
3,530 |
1,791 |
0.15% |
|
PZU-Ukraine |
114 |
82,566,626 |
1,686,214 |
38,145 |
2.04% |
|
UASK |
470 |
891,295,214 |
45,174,815 |
106,370 |
5.07% |
|
Universal’na |
1 |
250,290 |
17,720 |
103 |
7.08% |
|
ASKA |
53 |
53,659,849 |
1,902,554 |
12,069 |
3.55% |
|
Brokbusiness |
313 |
471,092,650 |
15,044,727 |
74,755 |
3.19% |
|
UNICA |
16 |
162,347,296 |
4,862,266 |
34,635 |
2.99% |
|
Total |
1,981 |
3,199,664,378 |
108,063,789 |
540,057 |