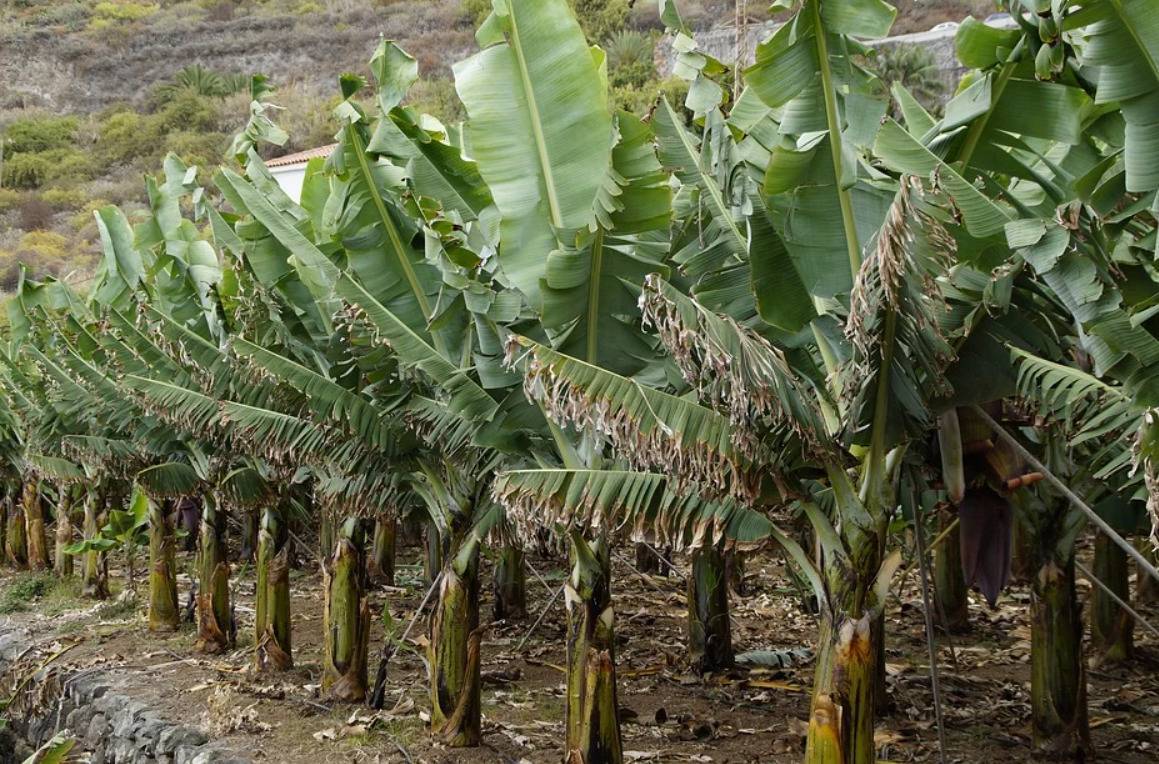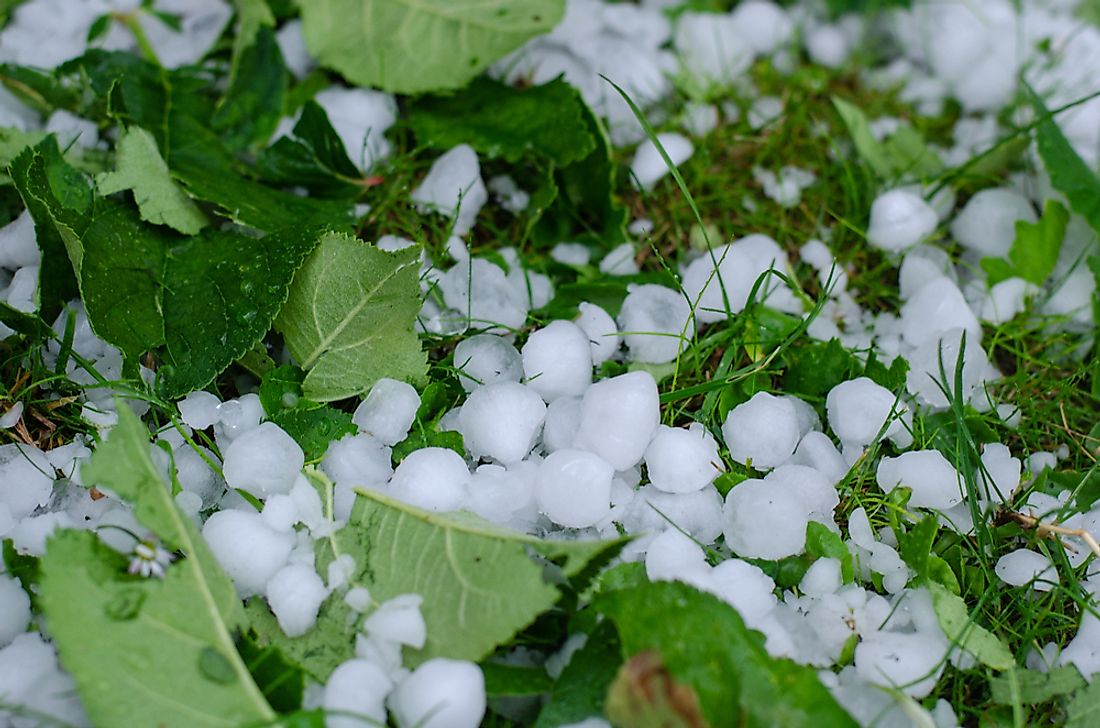
This paper focuses on agricultural production risk management, explaining key concepts, understanding why crop insurance markets have been slow to develop, and making recommendations about how to build sustainable markets in developing country contexts, with information drawn from Latin America and the Caribbean. The paper identifies three types of natural phenomena as the dominant risks to agicultural yield. They are: hydro-meteorological (rain, floods, droughts, high winds, tornados, hurricanes) geological (including earthquakes, volcanic eruptions, and tsunamis) biological (including include diseases and insect infestations).
It further classifies these risks as either catastrophic or non-catastrophic, depending on frequency, scale, intensity, and duration and notes that over the last decade the occurrence of natural disasters has been trending upward.
The paper notes that farmers in most developing countries have little access to formal agricultural insurance products that would allow them to transfer production risk to other parties. However, it also notes that agricultural insurance is reemerging as a topic of interest, especially in light of the need to improve agricultural competitiveness in increasingly integrated commodity markets.
The paper presents challenges in providing this service, including lack of information, inability to pay high premiums and the the tendency of governments to undermine market development through inappropriate use of subsidies and disaster relief funds. It recommends that: farm insurance should not be not be seen as a panacea for unprofitable farms, management failures governments have a vital role to play in providing the necessary information needed to measure, evaluate, and monitor risk, but also need to put public funds into creating favourable market conditions for the development of the industry farmers should be trained how to reduce and cope effectively with some of the production risks on-farm through better management practices and diversification strategies rules for accessing governmental disaster relief should not remove or undercut incentives for the adoption of better on-farm management techniques, the purchase of private agricultural insurance, or the accumulation of personal savings.
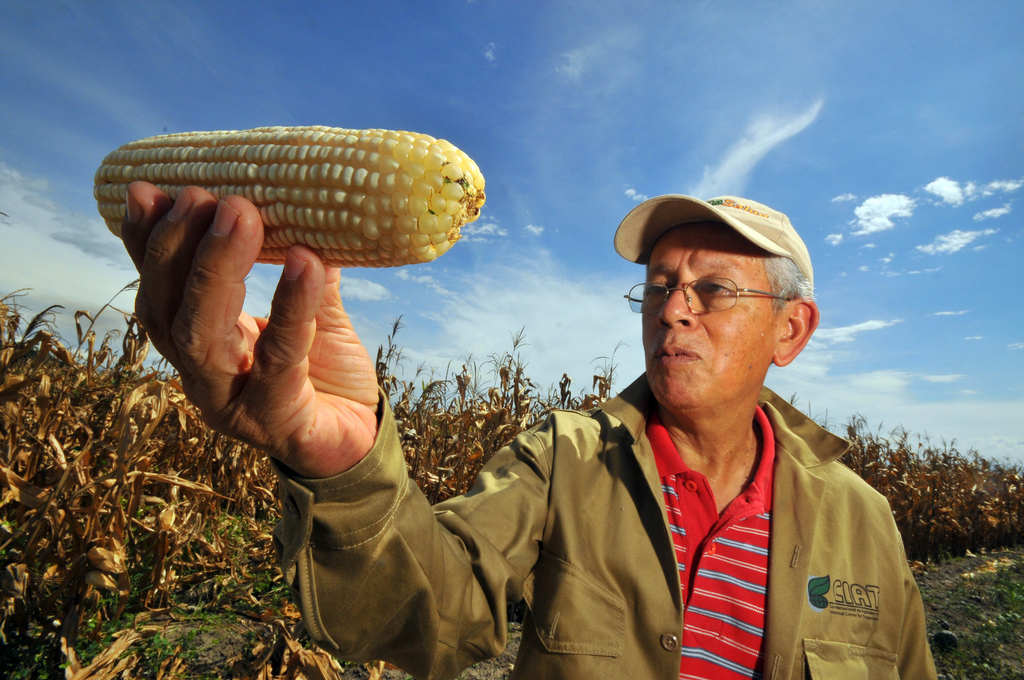
Agriculture is an inherently risky business. It is subject to a number of random price, climatic, biological, and geological shocks that require coping strategies and financial management instruments to deal with the implications. Traditional risk management strategies and ex post government provided emergency relief have often not proven to be sufficiently effective and robust in preventing serious economic loss or permitting a speedy recovery. This paper focuses on production risk management, explaining key concepts, understanding why crop insurance markets have been slow to develop, and making recommendations about how to build sustainable markets in developing country contexts.
For the most part, producers in developing countries are quite exposed to weather vagaries and have little access to formal agricultural insurance products that would allow them to transfer production risk to other parties. Agricultural insurance was more widespread in Latin America and other developing regions of the world during the 1960s and 1970s. However, most of the comprehensive, multiple peril programs common then, encountered financial difficulties and were either scaled back or completely closed. At present in Latin America, the volume of agricultural insurance premiums is a miniscule share of total insurance premiums.
Nonetheless, agricultural insurance is reemerging as a topic of interest, especially in light of the need to improve agricultural competitiveness in increasingly integrated commodity markets. The challenge is how to overcome obstacles and deliver efficient and sustainable agricultural insurance products. The principal obstacles—lack of high quality information, inadequate regulatory frameworks, weak supervision, lack of actuarial expertise, lack of professional expertise in designing and monitoring agricultural insurance products, a mass of low-income, dispersed clients, who may not be willing or able to pay actuarially sound premiums for multiple peril products, and the tendency of governments to undermine market development through inappropriate use of subsidies and disaster relief funds--are highlighted and discussed. Case studies on Uruguay, the Dominican Republic, and Peru reveal how crop insurance products are evolving and/or what government-supported initiatives are under the way to expand coverage. Recommendations of how to build markets step-by-step and the importance of applying new technology to lower costs are made.
Agricultural insurance is presented as important financial risk management tool but not as a panacea for unprofitable farms, management failures, underinvestment in public infrastructure, or compensation for other poorly functioning factor markets. Different types of agricultural insurance products—single peril, multiple peril, parametric, and revenue—each have a niche but should adhere to basic principles of actuarial fairness, seek to minimize problems with adverse selection, moral hazard, and administrative costs. Governments have a vital role to play in providing the necessary information needed to measure, evaluate, and monitor risk, in maintaining an auspicious but sound regulatory and supervisory framework, in helping with reinsurance and catastrophic disaster relief, and supporting private insurance providers with technical assistance and training. Often time, the argument is made that “public subsidies for premiums” are necessary in order to make premiums more affordable for the majority of farmers. The argument presented here is that scarce pubic monies may be better spent on creating favorable market conditions for the development of the industry ( i.e. the maintenance of databases, training, and pilots) than on making transfers to private individuals. In the context of developing countries, with large rural populations (often exceeding 20%), sizeable agrarian sectors (agricultural share of GDP >10 %, agricultural exports as a share of total exports > 30%), and severe fiscal constraints, agricultural insurance systems should be cost effective and operate as part of a larger, layered risk management framework. Installing comprehensive and universal systems, as is the case for several industrialized countries, may be an inefficient use of scarce public monies for developing countries. In a layered framework, farmers should be trained how to reduce and cope effectively with some of the production risks on-farm through better management practices and diversification strategies; how to transfer some of the production risks to financial markets through efficient and sustainable instruments (insurance, savings, and credit); and how to rely on the government assistance for catastrophic events. In the latter case, rules for accessing disaster relief should be clear ex ante and not remove or undercut incentives for the adoption of better on-farm management techniques (moral hazard), the purchase of private agricultural insurance, or the accumulation of personal savings.