

Weather index insurance for agriculture and rural areas in lower-income countries
16.01.2008 1527 views
American Journal of Agricultural Economics • Dec, 2007
Innovations in risk transfer for natural disasters in lower-income countries, in particular weather index insurance products, can be used to shift various weather-related risks. This article discusses the linkage between weather risk and poverty; provides background information on weather index insurance products; describes requirements for the implementation of weather index insurance and possible roles for governments, donors, and international financial institutions in facilitating implementation; and briefly reviews recent efforts to provide weather index insurance products in rural areas of some middle- and lower-income countries.
Weather Risk and Poverty
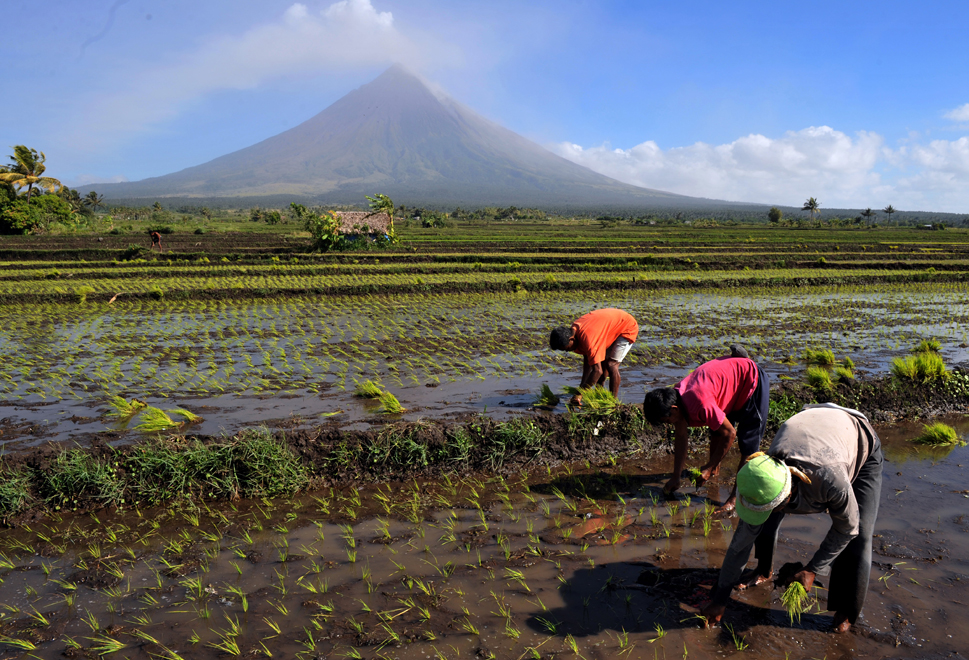
Approximately 1 billion people live on less than $1 per day. Three-quarters of those live in rural areas (Chen and Ravallion 2007), and over one-half depend on agriculture or agricultural labor as their primary source of livelihood (International Fund for Agricultural Development 2001). Thus, poor rural households are particularly susceptible to the financial consequences of weather-related natural disasters. Even if they are not directly involved in agricultural production, many of the rural poor have income sources that are tied to the success of agricultural production or are otherwise highly susceptible to extreme weather events.
While health problems are often cited as the greatest risk facing many rural households, uninsured weather risks also contribute both directly and indirectly to the existence of chronic poverty. Extreme weather events, such as droughts and floods, can directly destroy productive assets that have accumulated at high opportunity cost through years of foregone consumption. Households that are thrust into poverty by such shocks often find it difficult to recover and restart the long process of accumulating productive assets (Carter et al. 2007).
The risk of extreme weather events also contributes indirectly to the existence of chronic poverty. Households that recognize the potential for weather-related shocks are often reluctant to forego short-term consumption to invest in risky productive assets. Instead, they adopt low-risk, low-return investment strategies that reduce their exposure to extreme weather events but also keep the household trapped in chronic poverty (Rosenzweig and Binswanger 1993; Carter and Barrett 2006).
In some areas the rural poor protect themselves from weather-related losses using various structural mitigation measures. Examples would include supplemental irrigation to offset the risk of insufficient rainfall or dams and levies to control flooding. However, these structural mitigation strategies are not always feasible, reliable, or cost-effective. Households can also mitigate the financial effects of risk through savings, diversification, share tenancy, producing lower risk outputs, or producing outputs that require less investment in risky productive assets. However, these strategies may not be available to all households. Further, the implied risk premium on such risk mitigation strategies can be very high. Rosenzweig and Binswanger (1993) estimated the implied risk premium for risk mitigation strategies employed by some households in rural India at 35%.
In principle, traditional insurance instruments, including crop insurance, can be used to transfer the risk of extreme weather events. However, insurance markets are underdeveloped and often nonexistent in rural areas of lower income countries due to poor contract enforcement, asymmetric information, high transaction costs, and high exposure to spatially covariate risks (Skees and Barnett 2006). These problems are particularly acute for crop insurance.
Weather Index Insurance
In recent years, researchers and development organizations have been exploring the potential for using weather index insurance to provide risk management opportunities for the rural poor. Weather index insurance pays indemnities based not on actual losses experienced by the policyholder but rather on realizations of a weather index that is highly correlated with actual losses. In its simplest form a weather index measures a specific weather variable (e.g., rainfall or temperature) at a specific weather station over a defined period of time. Weather index insurance policies specify a threshold and a limit that establish the range of values over which indemnity payments will be made. If the insurance policy is protecting against unusually high realizations of the weather variable (e.g., excess rainfall or extremely hot temperatures), an indemnity is paid whenever the realized value of the index exceeds the threshold. The limit is set higher than the threshold, and the indemnity increases as the realized value of the index approaches the limit. No additional indemnity is paid for realized values of the index that exceed the limit. Conversely, if the policy is protecting against unusually low realizations of the weather variable (e.g., drought or extremely cold temperatures) an indemnity is made whenever the realized value of the index is less than the threshold, and the limit is set lower than the threshold.
To illustrate how weather index insurance works, consider the following example of an index insurance policy that protects against insufficient rainfall over a three-month period, with rainfall being measured at a specific weather station. The threshold is set at 100 millimeters of rainfall and the limit at 50 millimeters. Assume the policyholder purchases $1,000 of insurance protection. If the realized rainfall at the weather station is less than 100 millimeters, the policyholder will receive an indemnity equal to $20 for each millimeter less than 100 millimeters, up to a maximum of $1,000 for rainfall realizations of 50 millimeters or less. The indemnity does not depend on losses incurred by the policyholder but is based strictly on rainfall measured at the weather station.
Relative to traditional insurance products, weather index insurance has several advantages:
* The insurance contract is relatively straightforward, simplifying the sales process.
* Indemnities are paid based solely on the realized value of the underlying index. There is no need to estimate the actual loss experienced by the policyholder.
* Unlike traditional insurance products, there is no need to classify individual policyholders according to their risk exposure.
* There is little reason to believe that the policyholder has better information than the insurer about the underlying index. Thus, there is little potential for adverse selection. Also, there is little potential for ex ante moral hazard since the policyholder cannot influence the realization of the underlying weather index.
* Operating costs are low relative to traditional insurance products due to the simplicity of sales and loss adjustment; the fact that policyholders do not have to be classified according to their risk exposure; and the lack of asymmetric information. However, start-up costs can be quite significant. Reliable weather and agricultural production data and highly skilled agro-meteorological expertise are all critical for the successful design and pricing of weather index insurance products.
* Since no farm-level risk assessment or loss adjustment is required, the insurance products can be sold and serviced by insurance companies that do not have extensive agricultural expertise.
An important limitation of index insurance is that policyholders are exposed to basis risk. In this context basis risk refers to the imperfect correlation between the index and the losses experienced by the policyholder. It is possible for the policyholder to experience a loss and yet receive no index insurance indemnity. Likewise, it is possible for the policyholder to receive an index insurance indemnity and experience no loss. There are two potential sources of basis risk. First, losses may be caused by disease, insect infestation, or any number of factors other than the weather variable on which the index is based. Unless the index is based on a weather variable that is the dominant cause of loss in the region, basis risk will be unacceptably high. Second, the weather variable used to drive the index may not be highly spatially covariate. Thus, the measure of the weather variable at the farm or household may be quite different than the measure at the weather station. Basis risk can be reduced by offering weather index insurance only in areas where a particular, highly covariate weather variable (e.g., drought or extreme temperatures) is the dominant cause of loss.
Finally, it is important to recognize that in many cases the appropriate target market for weather index insurance may not be individual households. Instead, the appropriate markets may be various local-level risk aggregators--that is, organizations that do business with many households in the local area and thus are highly exposed to covariate weather risks. Examples would include microfinance entities and other formal or informal lenders, mutual-aid associations, farmers' cooperatives, input suppliers, output processors, and even local governments or disaster relief providers (Skees and Barnett 2006). Since these organizations aggregate risks from multiple households, they can effectively pool idiosyncratic risks; however, they remain highly vulnerable to extreme covariate weather events.
Requirements for Weather Index Insurance
While the basic concept is simple, effective implementation of weather index insurance is not at all simple. The continuing availability of accurate historical weather data is critical. It is also necessary to determine whether any of the available weather variables are in fact highly correlated with realized losses and if so, the time periods in which losses are most likely to occur. International experience has also shown that effective implementation requires careful attention to the services currently being provided by local risk aggregators as well as legal and regulatory constraints.
Governments, donors, and international financial institutions can facilitate the offering of weather index insurance by assisting with demand assessment; establishing an appropriate legal and regulatory framework; collecting and managing the required data; training insurance suppliers and providing objective information to potential users of weather index insurance; developing and pilot-testing potential weather index insurance products; and possibly providing some level of catastrophic risk-sharing. Each of these is discussed below.
Demand Assessment
Before investing in data collection and product development, it is important to assess the potential demand for weather index insurance in a particular area. Personal interviews, focus groups, and surveys can be used to determine answers to the following questions: What are the key weather perils of concern? How frequently do the perils occur and how significant is the impact? Who is affected by these perils? What mitigation or informal risk transfer strategies are currently being employed? What is the (opportunity) cost of those strategies? How much are end users willing and able to pay for an insurance product?
Legal and Regulatory Framework
To facilitate the offer of weather index insurance, governments must establish an appropriate legal and regulatory framework. The legal framework should address not only the proper regulation of insurance sales but also contract enforcement. In many lower-income countries insurance is so poorly understood that courts often force insurance providers to pay indemnities for losses that were clearly not covered under the contract provisions. Conversely, insurance providers may refuse to pay claims to poor policyholders because they know that the policyholders cannot afford to have an attorney represent them in court. Thus, to protect the interests of small-scale policyholders, some sort of binding arbitration procedure is typically desirable.
Even in countries where the legal and regulatory system is more highly developed, the existing regulatory standards for traditional insurance products may not be appropriate for index insurance products. Index insurance creates unique regulatory challenges because the indemnities are not based on the actual loss incurred. Also, index insurance is highly exposed to spatially covariate losses; so the minimum capital (or contingent capital) requirements need to be higher than those for traditional insurance.
Data Collection and Management
For weather index insurance to be successful, both the insurer and the policyholder must have confidence that the index is being measured accurately and the data are secure from tampering. To build this confidence, the underlying index should be measured by a trusted government or private source of publicly available weather data.
In addition, a sufficient amount of historical (normally daily) data on the underlying weather variable must be available for the insurer to estimate premium rates. The amount of historical data required depends on the frequency of occurrence of the risk. Twenty years of data may be sufficient to set initial premium rates for relatively frequent weather events. Thirty or forty years of data may not be sufficient for infrequent but potentially catastrophic weather events. Without sufficient data on which to base premium rates, the insurer will either refuse to sell the insurance or add a large premium load to account for uncertainty.
Since weather data have public goods characteristics, they are unlikely to be collected, cleaned, archived, and made publicly available by private-sector companies. Government meteorological bureaus usually provide these services. However, many lower-income countries find it difficult to adequately fund meteorological bureaus or sustain a sufficient network of weather stations. To facilitate the availability of weather index insurance, some donor organizations have provided funding for expanded meteorological services in lower-income countries.
Training of Insurance Suppliers and Consumer Education
Insurance suppliers in lower-income countries are unlikely to be familiar with weather index insurance. Thus, they require training and capacity building opportunities to build the expertise needed to offer these unique insurance instruments.
Similarly, in rural areas of many lower-income countries, insurance products are not widely available. Even if potential policyholders are familiar with other types of insurance products, they will almost certainly not be familiar with weather index insurance. To make an informed purchase decision, it is critically important that potential policyholders understand the basis risk inherent with weather index insurance. That is, they need to understand that they may experience a loss but not receive an indemnity. Thus, the successful introduction of weather index insurance will require a significant educational effort. While insurance suppliers will provide some information as part of their sales efforts, potential policyholders also need information from objective sources.
Government entities and donor organizations can provide training on weather index insurance to insurance suppliers. They can also serve as an objective source of information and educational materials for potential policyholders.
Product Development
Once a weather index insurance product is developed and offered for sale by an insurance supplier, it can easily be copied by competitors, since the underlying index is based on publicly available data. This "free rider" problem makes it very unlikely that private-sector insurance suppliers will invest in the research and development required to bring a weather index insurance product to the market. For this reason governments and donors have tended to fund feasibility studies and pilot tests of new weather index insurance products.
Catastrophic Risk-Sharing
Local suppliers of weather index insurance policies must be able to transfer their loss exposure outside of the local area. Traditional lines of insurance (e.g., automobile, life, property and casualty) are offered on loss events that are largely uncorrelated, so the law of large numbers reduces the variance in indemnities for local insurance providers. But weather index insurance protects against spatially covariate loss events. When a policyholder collects an indemnity on a weather index insurance product, all other holders of that same policy will be collecting indemnities as well. This implies that, in any given year, indemnities can be very high relative to premiums collected. While in principle it may be possible for insurance suppliers to set aside adequate liquid reserves to cover the potential for large indemnities, in practice this is highly unlikely. There is a high opportunity cost associated with keeping such large amounts of capital in investments that can be readily liquidated. Further, in many countries there are tax disincentives for holding large reserves. Thus, index insurance suppliers generally obtain contingent capital via reinsurance. Catastrophe bonds and contingent loan mechanisms can also be used as sources of contingent capital.
Governments and donors may also assist with providing contingent capital to suppliers of weather index insurance. Some evidence suggests that those at risk tend to ignore the probability of the most extreme and infrequent loss events (Kunreuther 1996; Kunreuther and Slovic 1978). But insurers and reinsurers of weather index insurance cannot afford to ignore the potential for such events. They must load premium rates to reflect the potential for highly infrequent weather events, including events that are more extreme than any in the available historical data. Since there are no data from which to calculate the frequency and magnitude of such extreme events, insurers and reinsurers tend to be extremely conservative when calculating the premium load. This creates a gap between what buyers are willing to pay and what sellers are willing to accept for protection against extreme weather events.
To address this market failure, governments or donors can provide contingent financing (e.g., reinsurance or contingent loans) for extreme realizations of the weather variable underlying the weather index insurance product. To keep from crowding-out private sector risk transfer markets, any government or donor contingent financing should be carefully structured so that it covers only the most extreme weather events. If insurance suppliers can obtain contingent financing for this extreme tail risk at a reasonable cost, they can pass along the benefits in lower premium costs to policyholders. This will increase the number of policies sold, thus increasing market opportunities for reinsurers to provide contingent financing against all but the most extreme weather events.
International Experience
Experience with weather index insurance in middle and lower income countries is both too limited and too recent to draw conclusions about its long-run sustainability. Table 1 lists some middle- and lower-income countries where weather index insurance has been sold to date. However, except for Mexico and India, sales have occurred within pilot programs; so the volume of business has been marginal. In addition, weather index insurance products are currently being developed in several countries (table 2).
Among middle- and lower-income countries, Mexico and India currently have the most developed weather index insurance programs. In both countries the products offered focus primarily on rainfall deficiency (drought). Also, in both countries technical support, provided by international organizations, facilitated the offering of weather index insurance products.
Mexico
The Mexican public reinsurance company Agroasemex has been providing weather index insurance since 2001. Most of the policies are based on rainfall, but some have been based on temperature and wind speed. The policies are marketed primarily to state governments in Mexico to protect against calamities (mainly drought) in the states and are linked to the social program Fondo Nacional para Desastres Naturales (Natural Disasters Fund--FONDEN). In 2005, 1.16 million hectares in eighteen states were covered by the contracts. In 2006, 2.3 million hectares were covered. This represents 28% of the dry-land (nonirrigated) crop area in Mexico. The main limiting factor to providing wider coverage is a lack of rainfall data and weather stations.
India
Agriculture accounts for around 23% of India's gross domestic product. An estimated 65 % of the population is engaged in agriculture and associated activities. Most of the agricultural production is small-scale. Of the more than 120 million landowners, 80 % own parcels of less than 2 hectares. Weather risk is a major concern to agricultural producers and agribusinesses alike. It is estimated that rainfall variability accounts for more than 50% of the variability in crop yields.
Weather index insurance was first introduced in India in 2003. In collaboration with the microfinance institution BASIX, ICICI Lombard General Insurance Company began selling a rainfall index insurance product. BASIX holds no risk on the insurance policies but instead acts as an intermediary that receives commissions from selling the index insurance to its customers. Between June 2003 and March 2006, BASIX sold a total of 7,653 rainfall index insurance policies in six Indian states.
The parastatal agriculture insurance company AICI introduced a weather index insurance product in 2004. In 2005-06, AICI sold weather index insurance policies to more than 125,000 farmers. Most (98%) were sold to farmers in the State of Maharashtra. The World Bank has provided technical assistance to the Government of India and AICI in the development of weather index insurance. This assistance has focused on product design, rating, and large scale implementation.
Conclusion
Effective mechanisms for transferring risk can catalyze investment and economic growth, thus contributing to poverty reduction in rural areas of lower income countries. Weather index insurance is a relatively simple concept that under certain circumstances can effectively transfer spatially covariate weather risks. While experience to date is too limited and too recent to draw general conclusions about the long-run sustainability of weather index insurance, the experience in Mexico and India suggests that at least in some areas, these products may prove to be a valuable risk transfer mechanism for the rural poor.
Innovations in Risk Transfer for Natural Disasters in Lower-Income Countries (Jerry Skees, University of Kentucky and Barry Barnett, University of Georgia, Organizers)
References
Carter, M.R., and C.B. Barrett. 2006. "The Economics of Poverty Traps and Persistent Poverty: An Asset Based Approach." Journal of Development Studies 42:178-99.
Carter, M.R., P.D. Little, T. Mogues, and W. Negatu. 2007. "Poverty Traps and Natural Disasters in Ethiopia and Honduras." World Development 35:835-56.
Chen, S., and M. Ravallion. 2007. "Absolute Poverty Measures for the Developing World, 1981-2004." Development Research Group, The World Bank: Washington, DC
International Fund for Agricultural Development. 2001. Rural Poverty Report 2001. Oxford: Oxford University Press.
Kunreuther, H. 1996. "Mitigating Disaster Losses through Insurance." Journal of Risk and Uncertainty 12:171-87.
Kunreuther, H., and P. Slovic. 1978. "Economics, Psychology, and Protective Behavior." American Economic Review 68:64-69.
Rosenzweig, M.R., and H.P. Binswanger. 1993. "Wealth, Weather Risk and the Composition and Profitability of Agricultural Investments." Economic Journal 103:56-78.
Skees, J.R., and B.J. Barnett. 2006. "Enhancing Microfinance Using Index Based Risk-Transfer Products." Agricultural Finance Review 66:235-50.
Barry Barnett is Associate Professor in the Department of Agricultural Economics at Mississippi State University. Olivier Mahul is Senior Insurance Specialist and Program Manager, Insurance for the Poor Unit, Financial and Private Development Vice Presidency of the World Bank.
This article was written when Barnett was Associate Professor in the Department of Agricultural and Applied Economics at the University of Georgia.
This article was presented in a principal paper session at the AAEA annual meeting (Portland, OR, July 2007). The articles in these sessions are not subjected to the journal's standard refereeing process.
Barnett, Barry J.^Mahul, Olivier
EVENTS

2024 AgroInsurance International Conference: New Partners and Agenda updates
26.02.20242024 AgroInsurance International Conference will take place on June 3-5, 2024 in Belgrade, Serbia, at the Hyatt Regency Hotel. Planet Labs (USA) and GAF AG (Germany) are sponsors of our conference. Agremo (Serbia) has been confirmed as the Organization Partner. More partners and sponsors to be announced in March 2024.
RISK EVENTS
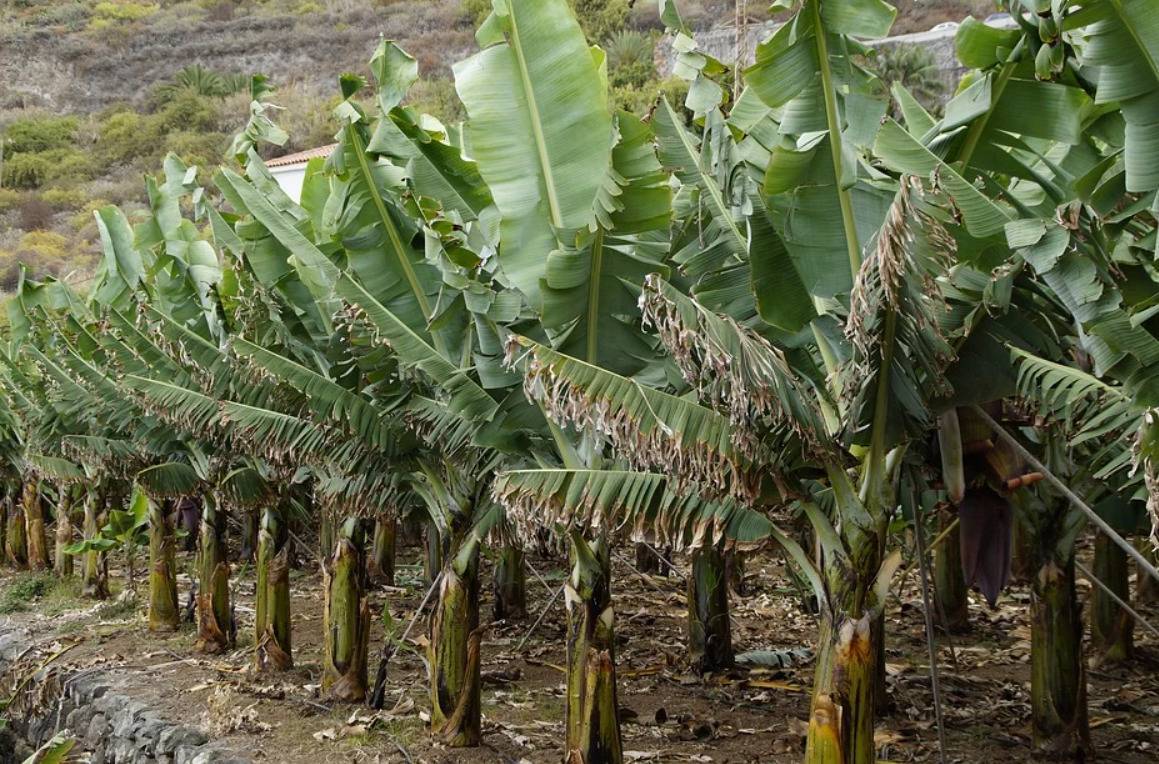
Spain - 30% of La Palma's banana production has already been lost due to the advance of the lava
14.10.2021More than three weeks after the Cumbre Vieja volcano erupted, the lava that continues to flow from its interior continues to devastate everything in its path, destroying houses, infrastructure, and banana plantations. The production of Platanos de Canarias is the economic engine of the island, accounting for 50% of its GDP and 30% of the jobs on the island.
25.10.2022
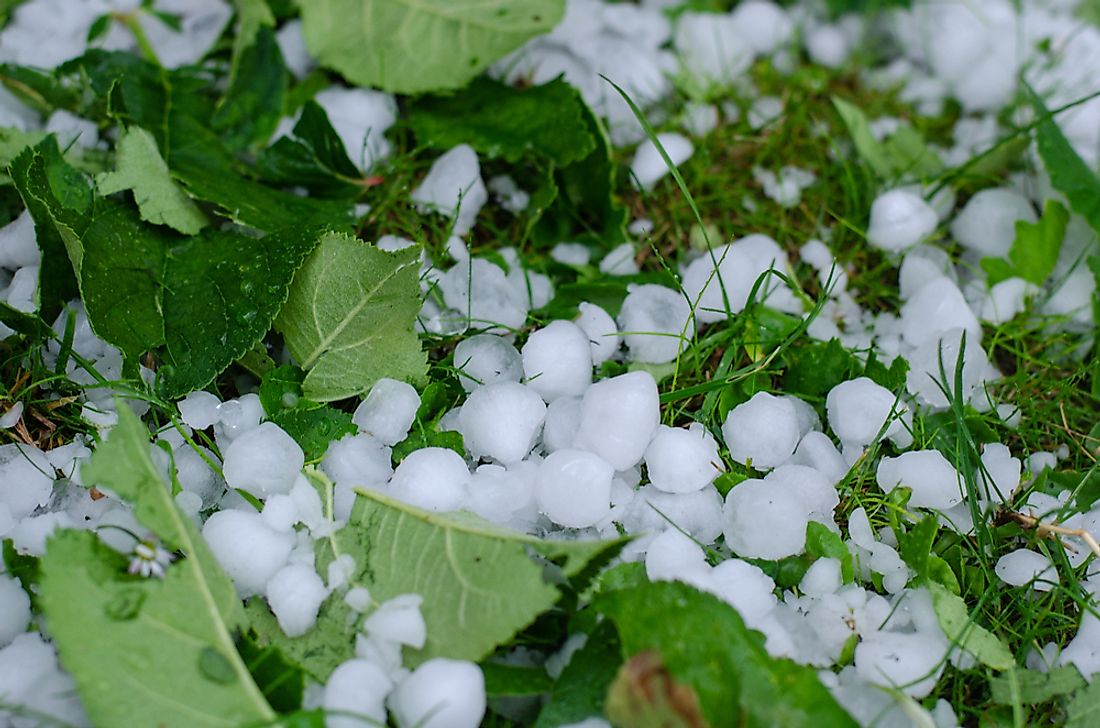
A Practical Method for Adjusting the Premium Rates in Crop-Hail Insurance with Short-Term Insurance Data
The frequency of hailstorms is generally low in small geographic areas. In other words, it may be very likely that hailstorm occurrences will vary between neighboring locations within a short period of time. Besides, a newly launched insurance scheme lacks the data. It is, therefore, difficult to sustain a sound insurance program under these circumstances, with premium rates based on meteorological data without a complimentary adjustment process.
18.10.2019
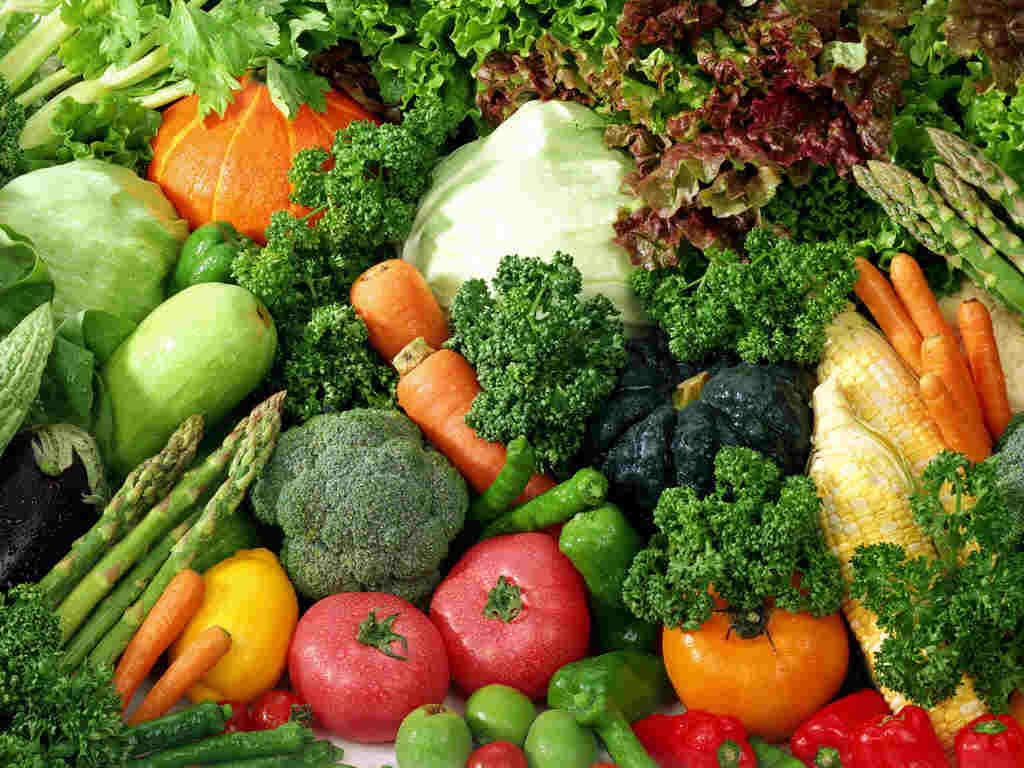
Malta - Vegetable production dropped 7% in 2018
Last year, Malta’s local vegetable produce dropped by 7% when compared to the previous year. The total vegetables produced in tonnes amounted to 58,178, down by 7% when compared to 2017. Their value too diminished as the total produce was valued at €30 million, down by 13% over the previous year. The most significant drop was in potatoes, down by 27% over the previous year. Tomatoes and onions were the only vegetables to have increased in volume, by 3% and 4% respectively but their value diminished by 9% and 24% respectively. The figures were published by the National Statistics Office on the event of World Food Day 2019, which will be celebrated on Wednesday. Cauliflower, cabbage and lettuce produce dropped by 10%, 3%, and 12% respectively. In the realm of local fruit, a drop of produce was registered here too apart from strawberries, which experienced a whopping increase of 58% over 2017. Total fruit produced in 2018 amounted to 13,057 tonnes, down by 1% when compared to 2017. The total produce was valued at €10 million, a 3% increase in value. Peaches produced were down by 35% and the 376 tonnes of peaches cultivated amounted to €0.5 million in value. Orange produce dropped by 10% and lemon produce dropped by 14%. There was no change in the amount of grapes produced and the 3,642 tonnes of grapes produced in 2018 were valued at €2.3 million. 70% of fruit and vegetables consumed in Malta is imported. The drop in local produce could be the result of deleterious or unsuitable weather patterns. Source - https://www.freshplaza.com
07.10.2019
USA - Greenhouse tomato production spans most states
While Florida and California accounted for 76 percent of U.S. production of field-grown tomatoes in 2016, greenhouse production and use of other protected-culture technologies help extend the growing season and make production feasible in a wider variety of geographic locations. Some greenhouse production is clustered in traditional field-grown-tomato-producing States like California. However, high concentrations of greenhouses are also located in Nebraska, Minnesota, New York, and other States that are not traditional market leaders. Among the benefits that greenhouse tomato producers can realize are greater market access both in the off-season and in northern retail produce markets, better product consistency, and improved yields. These benefits make greenhouse tomato production an increasingly attractive alternative to field production despite higher production costs. In addition to domestic production, a significant share of U.S. consumption of greenhouse tomatoes is satisfied by imports. In 2004, U.S., Mexican, and Canadian growers each contributed about 300 million pounds of greenhouse tomatoes annually to the U.S. fresh tomato market. Since then, Mexico’s share of the greenhouse tomato market has grown sharply, accounting for almost 84 percent (1.8 billion pounds) of the greenhouse volume coming into the U.S. market. Source - https://www.freshplaza.com
03.10.2019

World cherry production will decrease to 3.6 million tons
According to information from the USDA for the 2019-2020 season, world cherry production is expected to decrease slightly and amount to 3.6 million tons. This decline is due to the damages that the weather caused on cherry crops in the European Union. Even though Chile is expected to achieve a record export, world trade in cherries is expected to drop to 454,000 tons, based on lower shipments from Uzbekistan and the US. Turkey Turkey's production is expected to increase to 865,000. As a result of the strong export demand, producers continue to invest and improve their orchards, switching to high yield varieties and gradually expanding the surface for sweet cherries. More supplies are expected to increase exports to a record 78,000 tons, continuing its long upward trend. Chile Chile's production is forecast to increase from 30,000 tons to 231,000 as they have a larger area of mature trees. Between 2009/10 and 2018/19, the crop area has almost tripled, a trend that is expected to continue. The country is expected to export up to 205,000 tons in higher supplies. The percentage of exports destined for China has increased from 13 to almost 90% since 2009/10. China China's production is expected to increase by up to 24% and to amount to 420,000 tons, due to the recovery of the orchards that were damaged by frost last year. In addition, there are new crops that will go into production. Imports are expected to increase by 15,000 tons and to stand at 195,000 tons, as the increase in supplies from Chile will more than compensate for the lower shipments from the United States. Although higher tariffs are maintained for American cherries, the United States is expected to remain China's main supplier in the northern hemisphere. United States US production is expected to remain stable at 450,000 tons. Imports are expected to increase to 18,000 tons with more supplies available from Chile. Exports are forecast to decrease for the second consecutive year to 80,000 tons, as high retaliatory tariffs continue to suppress US shipments to China. If this happens, it will be the first time that US cherry exports experience a decrease in 2 consecutive years since 2002/03, when production suffered a fall of 44%. European Union EU production is projected to fall by more than 20%, remaining at 648,000 tons because of the hail that affected the early varieties in Italy, and the frost, low temperatures, and drought that caused a significant loss of fruit in Poland, the main producer. Lower supplies are expected to pressure exports to 15,000 tons and increase imports to 55,000 tons. Russia Russia's imports are expected to contract by 13,000 tons to 80,000 with lower supplies from Kazakhstan, Moldova, and Serbia. Source - https://www.freshplaza.com
09.08.2019
EU - 20% fewer apples and 14% fewer pears than last year
This year's European apple production is expected to come to 10,556,000 tons. That is 20% less than last year. It is also 8% less than the average over the past three years. The European pear harvest is expected to be 2,047,000 tons. This is 14% lower than last year and 9% less than the previous three seasons average. These figures are according to the World Apple and Pear Association, WAPA's top fruit prognoses. They presented their report at Prognosfruit this morning. Apple harvest per country Poland is Europe's apple-growing giant. This country is expected to process 44% fewer apples. The yield is expected to be 2,710,000 tons. Last year, this was still 4,810,000 tons. In Italy, yields are only three percent lower than last year. According to WAPA, this country will have an apple harvest of 2,195,000 tons. France takes third place. They will even have 12% more apples than last year to process - 1,652,000 tons. Pear harvest per country With 511,000 tons, Italy's pear harvest is much lower than last year. It has dropped by 30%. In terms of the average over the previous three seasons, this fruit's yield is 29% lower. In the Netherlands, the pear harvest is expected to be six percent lower, at 379,000 tons. This volume is still 3% more than the average over the last three years. Belgium has 10% fewer pears (331,000 tons) than last year. They are just ahead of Spain. With 311,000 tons, Spain who will harvest four percent more pears. Apple harvest per variety The Golden Delicious remains, by far, the largest apple variety in Europe. It is expected that 2,327,000 tons of these apples will be harvested this year. This is three percent less than last year. At 1,467,000 tons, Gala estimations are exactly the same as last year. The European Elstar harvest will also be roughly equivalent to last year. A volume of 355,000 tons of this variety is expected. Pear harvest per variety Looking at the different varieties, the European Conference is estimated to be 8% lower than last year. A volume of 910,000 tons is expected. The low Italian pear estimate will result in 34% fewer Abate Fetel pears (211,000 tons) being available. This is according to WAPA's estimate. This makes this variety smaller than the Williams BC (230.000 ton) in Europe. Source - https://www.freshplaza.com
30.01.2018

Spring frost losses and climate change not a contradiction in terms - Munich Re
Between 17 April and 10 May 2017, large parts of Europe were hit by a cold snap that brought a series of overnight frosts. As the budding process was already well advanced due to an exceptionally warm spring, losses reached historic levels – particularly for fruit and wine growers: economic losses are estimated at €3.3bn, with around €600m of this insured. In the second and third ten-day periods of April, and in some cases even over the first ten days of May 2017, western, central, southern and eastern Europe experienced a series of frosty nights, with catastrophic consequences in many places for fruit growing and viticulture. The worst-affected countries were Italy, France, Germany, Poland, Spain and Switzerland. Losses were so high because vegetation was already well advanced following an exceptionally warm spell of weather in March that continued into the early part of April. For example, the average date of apple flowering in 2017 for Germany as a whole was 20 April, seven days earlier than the average for the period 1992 to 2016. In many parts of Germany, including the Lake Constance fruit-growing region, it even began before 15 April. In the case of cherry trees – whose average flowering date in Germany in 2017 was 6 April – it was as much as twelve days earlier than the long-term average. The frost had a devastating impact because of the early start of the growing season in many parts of Europe. In the second half of April, it affected the sensitive blossoms, the initial fruiting stages and the first frost-susceptible shoots on vines. Meteorological conditions The weather conditions that accounted for the frosty nights are a typical feature of April, and also the reason for the month’s proverbial reputation for changeable weather. The corridor of fast-moving upper air flow, also known as the polar front, forms in such a way that it moves in over central Europe from northwesterly directions near Iceland. This north or northwest pattern frequently occurs if there is high air pressure over the eastern part of the North Atlantic, and lower air pressure over the Baltic and the northwest of Russia. Repeated low-pressure areas move along this corridor towards Europe, bringing moist and cold air masses behind their cold fronts from the areas of Greenland and Iceland. Occasionally, the high-pressure area can extend far over the continent in an easterly direction. The flow then brings dry, cold air to central Europe from high continental latitudes moving in a clockwise direction around the high. It was precisely this set of weather conditions with its higher probability of overnight frost that dominated from mid-April to the end of the month. There were frosts with temperatures falling below –5°C, in particular from 17 to 24 April (second and third ten-day periods of April), and even into the first ten-day period of May in eastern Europe. The map in Fig. 2 shows the areas that experienced night-time temperatures of –2°C and below in April/May. High losses in fruit and wine growing Frost damage to plants comes from intracellular ice formation. The cell walls collapse and the plant mass then dries out. The loss pattern is therefore similar to what is seen after a drought. Agricultural crops are at varying risk from frost in the different phases of growth. They are especially sensitive during flowering and shortly after budding, as was the case with fruit and vines in April 2017 due to the early onset of the growing season. That was why the losses were so exceptionally high in this instance. In Spain, the cold snap also affected cereals, which were already flowering by this date. Even risk experts were surprised at the geographic extent and scale of the losses (overall losses: €3.3bn, insured losses: approximately €600m). Overall losses were highest in Italy and France, with figures of approximately a billion euros recorded in each country. Two basic concepts for frost insurance As frost has always been considered a destructive natural peril for fruit and wine growing and horticulture, preventive measures are widespread. In horticulture, for example, plants are cultivated in greenhouses or under covers, while in fruit growing, frost-protection measures include the use of sprinkler irrigation as well as wind machines or helicopters to mix the air layers. Just how effective these methods prove to be will depend on meteorological conditions, which is precisely why risk transfer is so important in this sector. There are significant differences between one country and the next in terms of insurability and insurance solutions. But essentially there are two basic concepts available for frost insurance: indemnity insurance, where hail cover is extended to include frost or other perils yield guarantee insurance covering all natural perils In most countries, the government subsidises insurance premiums, which means that insurance penetration is higher. In Germany, where premiums are not subsidised and frost insurance density is low, individual federal states like Bavaria and Baden-Württemberg have committed to providing aid to farms that have suffered losses – including aid for insurable crops such as wine grapes and strawberries. Late frosts and climate change There are very clear indications that climate change is bringing forward both the start of the vegetation period and the date of the last spring frost. Whether the spring frost hazard increases or decreases with climate change depends on which of the two occurs earlier. There is thus a race between these two processes: if the vegetation period in any given region begins increasingly earlier compared with the date of the last spring frost, the hazard will increase over the long term. If the opposite is the case, the hazard diminishes. Because of the different climate zones in Europe, the race between these processes is likely to vary considerably. Whereas the east is more heavily influenced by the continental climate, regions close to the Atlantic coastline in the west enjoy a much milder spring. A study has shown that climate change is likely to significantly reduce the spring frost risk in viticulture in Luxembourg along the River Moselle1. The number of years with spring frost between 2021 and 2050 is expected to be 40% lower than in the period 1961 to 1990. By contrast, a study on fruit-growing regions in Germany2 concluded that all areas will see an increase in the number of days with spring frost, especially the Lake Constance region, where reduced yields are projected until the end of this century. At the same time, however, only a few preliminary studies have been carried out on this subject, so uncertainty prevails. Outlook The spring frost in 2017 illustrated the scale that such an event can assume, and just how high losses in fruit growing and viticulture can be. Because the period of vegetation is starting earlier and earlier in the year as a result of climate change, spring frost losses could increase in the future, assuming the last spring frost is not similarly early. It is reasonable to assume that these developments will be highly localised, depending on whether the climate is continental or maritime, and whether a location is at altitude or in a valley. Regional studies with projections based on climate models are still in short supply and at an early stage of research. However, one first important finding is that the projected decrease in days with spring frost does not in any way imply a reduction in the agricultural spring frost risk for a region. So spring frosts could well result in greater fluctuations in agricultural yields. In addition to preventive measures, such as the use of fleece covers at night, sprinkler irrigation and the deployment of wind machines, it will therefore be essential to supplement risk management in fruit growing and viticulture with crop insurance that covers all natural perils. Source - ttps://www.munichre.com/
17.05.2014

Russia Livestock Overview: Cattle, Swine, Sheep & Goats
Private plots generate 48 percent of cattle, 43 percent of swine and 54 percent of sheep and goats in Russia. The Russian government recently approved a new program that will succeed the National Priority Project in agriculture (NPP) titled, “TheState Program for Development of Agriculture and Regulation of Food and Agricultural Markets in 2008-2012,” that encourages pork and beef production and attempts to address Russia’s declining cattle numbers. This program includes import-substitution policies designed to stimulate domestic livestock production and to protect local producers. In the beginning of 2007, the economic environment for swine production was generally unfavorable. The average production cost was RUR40-45/kilo of live weight, while the farm gate price was RUR40/kilo live weight. Pork producers have been expressing concern for years about sales after implementation of the NPP as pork consumption is growing at a slower rate than pork production. As a result, the pork sector has been lobbying the Russian government to regulate imports in spite of the meat TRQ agreement. From January-September 2007, 1.38 million metric tons (MMT) of red meat was imported. A 12-year decline in beef production has resulted in limited beef availability in the Russian market leading to a spike in prices. In response, the Russian government has been force to take steps to increase the availability of beef by lifting a meat ban on Poland and by looking to Latin America for higher volumes of product. Feed stocks decreased during the first 11 months of 2007 compared to the previous year which will likely create even greater financial problems for livestock operations in 2008 as feed prices continue to skyrocket. Grain prices increased rapidly in Russia through the middle of July 2007 before stabilizing at high levels as harvest progress reports were released. The Russian pig crop is expected to increase by 6 percent in 2008, while cattle herds are predicted to decrease by 3.5 percent. Some meat market analysts predict that by 2012, as new and modernized pig farming complexes reach planned capacity, pork production could reach 3.5 MMT – up 75 percent from 2008 estimates. According to the Russian Statistics Agency (Rosstat), 1/3 of all Russian “large farms” are unprofitable. Many of these are involved in livestock production. Small, inefficient producers are uncompetitive and have already begun disappearing from the market. The Russian veterinary service continues to playa decisive role in meat import supply management. Source - http://www.cattlenetwork.com
27.11.2012
Statistics Canada : Farm income, 2011
Realized net income for Canadian farmers amounted to $5.7 billion in 2011, a 53.1% increase from 2010. This rise followed a 19.0% increase in 2010 and a 19.6% decline in 2009. Realized income is the difference between a farmer's cash receipts and operating expenses, minus depreciation, plus income in kind. Realized net income fell in four provinces: Newfoundland and Labrador, Nova Scotia, Manitoba and British Columbia. In each, increases in costs outpaced gains in receipts. Farm cash receipts Farm cash receipts, which include market receipts from crop and livestock sales as well as program payments, rose 11.9% to $49.8 billion in 2011. This was the first increase since 2008. Market receipts alone increased 12.0% to $46.3 billion. Crop receipts, which increased 15.8% to $25.9 billion, contributed the most to the increase. Sales from livestock products rose 7.5% to $20.3 billion, the largest annual increase since 2005. Stronger prices for grains and oilseeds played a major role in the increase in crop revenues. For example, canola receipts increased 37.3% in 2011 on the strength of a 27.3% gain in prices. Grains and oilseed prices started rising in the last half of 2010 as a result of limited global stocks and strong demand. Even though prices peaked in mid-2011, prices for the year, on average, remained well above 2010 levels. Crop receipts rose in every province except Manitoba and Newfoundland and Labrador. In Manitoba, difficult growing conditions reduced marketings of most grains and oilseeds. In Prince Edward Island and New Brunswick, increases in potato prices and marketings helped push crop receipts higher. It was also stronger prices that were behind the rise in livestock receipts. Hog receipts increased 15.5% to $3.9 billion on the strength of a 14.7% price increase. Cattle prices rose 19.5% in 2011, while receipts increased 1.1% because of a reduced supply of market animals. Hog, cattle and calf prices increased in 2010. The upward trend continued throughout most of 2011, primarily because of low North American inventories and high feed grain costs. Receipts for producers in the three supply-managed sectors-dairy, poultry and eggs-increased 7.9% as rising prices reflected higher costs for feed grain and other production inputs. A 14.9% rise in chicken receipts exceeded increases for eggs (+8.7%) and dairy products (+5.3%). Program payments increased 11.2% to $3.5 billion in 2011. Increases in Quebec provincial stabilization payments as well as crop insurance payments in Manitoba and Saskatchewan accounted for much of the rise. Farm expenses Farm operating expenses (after rebates) were up 8.4% to $38.3 billion in 2011, the second-largest percentage increase since 1981. This increase followed two consecutive years of modest declines. Higher prices for fertilizer, feed and machinery fuel contributed to the increase in operating expenses. According to the Farm Input Price Index, both fertilizer and machinery fuel prices were up by over 25% in 2011. At the same time, feed grain prices increased by more than 30%. When depreciation charges were included, total farm expenses increased 8.2% to $44.1 billion. Depreciation costs rose 6.9%. Total farm expenses advanced in every province in 2011. The largest percentage increases occurred in Saskatchewan (+12.3%), Quebec (+9.5%) and Alberta (+9.0%). Total net income Total net income reached $5.8 billion, a $3.3 billion gain. There were large increases in Saskatchewan (+$2.1 billion), Alberta (+$567 million) and Ontario (+$470 million), while Newfoundland and Labrador, New Brunswick and Manitoba saw declines. Total net income adjusts realized net income for changes in farmer-owned inventories of crops and livestock. It represents the return to owner's equity, unpaid labour, and management and risk. The total value of farm-owned inventories rose by $165 million in 2011. A strong increase in deferred grain payments together with the first increase in cattle inventories since 2004 contributed to the rise. Note to readersRealized net income can vary widely from farm to farm because of several factors, including commodities, prices, weather and economies of scale. This and other aggregate measures of farm income are calculated on a provincial basis employing the same concepts used in measuring the performance of the overall Canadian economy. They are a measure of farm business income, not farm household income. Financial data for 2011 collected at the individual farm business level using surveys and other administrative sources will soon be tabulated and made available. These data will help explain differences in performance of various types and sizes of farms. For details on farm cash receipts for the first three quarters of 2012, see today's "Farm cash receipts" release. As a result of the release of data from the 2011 Census of Agriculture on May 10, 2012, data on farm cash receipts, operating expenses, net income, capital value and other data contained in the Agriculture Economic Statistics series are being revised, where necessary. The complete set of revisions will be released in the November 26, 2013, edition of The Daily. Table 1 Net farm income 2009 2010r 2011p 2009 to 2010 2010 to 2011 millions of dollars % change + Total farm cash receipts including payments 44,599 44,466 49,772 -0.3 11.9 - Total operating expenses after rebates 36,052 35,315 38,276 -2.0 8.4 = Net cash income 8,547 9,151 11,496 7.1 25.6 + Income-in-kind 39 40 45 2.6 11.1 - Depreciation 5,471 5,483 5,864 0.2 6.9 = Realized net income 3,115 3,709 5,677 19.0 53.1 + Value of inventory change -281 -1,157 165 ... ... = Total net income 2,834 2,551 5,842 ... ... Table 2 Net farm income, by province Canada Newfoundland and Labrador Prince Edward Island Nova Scotia New Brunswick Quebec millions of dollars 2010r + Total farm cash receipts including payments 44,466 118 407 500 479 7,171 - Total operating expenses after rebates 35,315 106 367 422 406 5,472 = Net cash income 9,151 12 41 78 73 1,699 + Income-in-kind 40 0 0 1 1 10 - Depreciation 5,483 8 41 59 54 727 = Realized net income 3,709 4 0 19 20 983 + Value of inventory change -1,157 -0 18 0 9 13 = Total net income 2,551 4 18 19 29 996 2011p + Total farm cash receipts including payments 49,772 120 477 527 533 7,967 - Total operating expenses after rebates 38,276 114 391 448 424 6,018 = Net cash income 11,496 6 86 79 109 1,949 + Income-in-kind 45 0 0 1 1 11 - Depreciation 5,864 9 43 62 55 767 = Realized net income 5,677 -2 43 18 55 1,194 + Value of inventory change 165 -0 -12 2 -50 -24 = Total net income 5,842 -3 31 20 5 1,170 Source - http://www.4-traders.com/
