Although most farmers file claims for justified losses, occasionally fraudulent claims are filed. Investigators with the US Department of Agriculture’s (USDA) Risk Management Agency (RMA) root out these schemes using modern crop monitoring. This integration of advanced technologies and data science techniques supports the investigative process.
The application of high-resolution aerial imagery to capture field conditions, machine learning algorithms to automate pattern detection, and GIS generates positive results. For example, RMA caught Colorado ranchers who tampered with rain gauges; Kentucky tobacco farmers who falsely reported hail damage; and a North Carolina farmer who produced crops, sold them under the names of other farmers, and claimed those crops were lost to natural disasters. Although it’s only a small number of farmers and ranchers who look for ways to game the system, the financial savings of rejected claims adds up.
“We’ve been able to document a cost avoidance through our Spot Check List program that amounts to more than $1.75 billion over the past 20-plus years,” said Jim Hipple, a physical scientist in the Business Analytics Division of USDA RMA. “Cost avoidance is even better than cost recovery because we haven’t paid anything out, so we don’t have that added burden of trying to pull money back.”
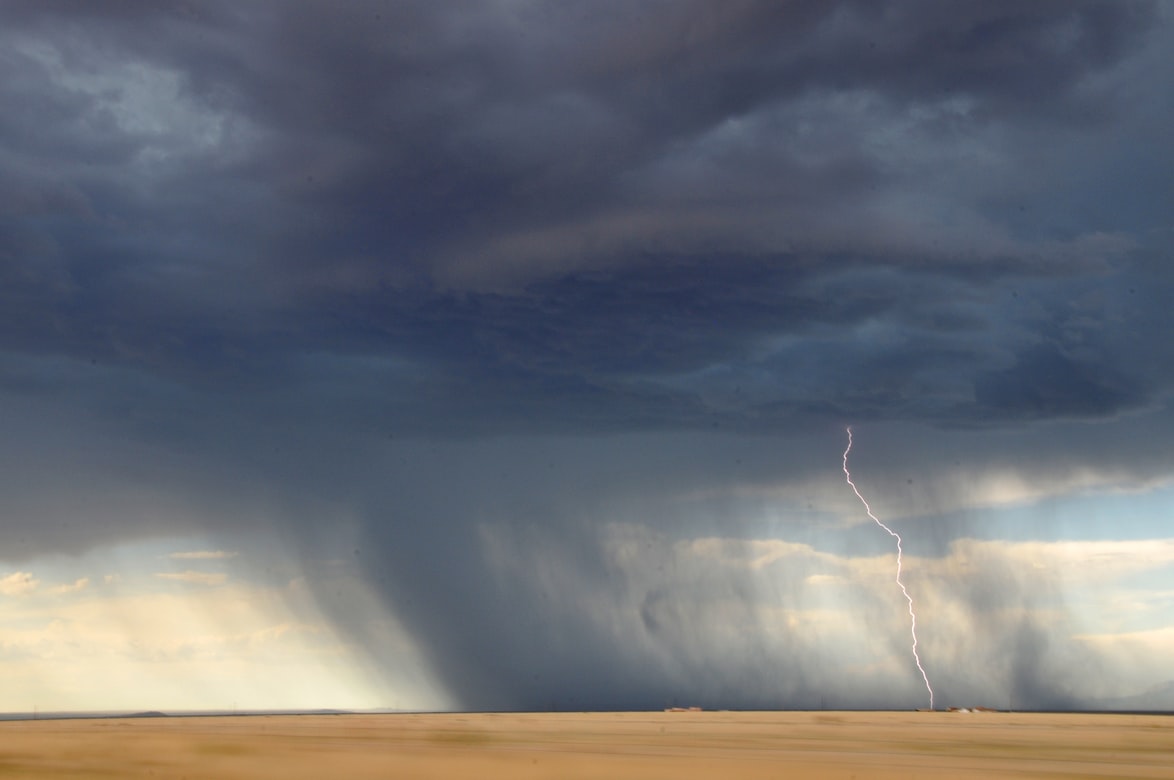
The work by Hipple and others at RMA also helps instill trust in the crop insurance system, which has an important role buffering farmers from major losses due to drought, excessive rain, hail, wind, frost, insects, and disease.
The Rise of Field-Level Awareness
“Crop insurance policies have gotten more specific about the field location,” Hipple said. “That helped us better understand conditions on each farm.”
The USDA Farm Service Agency, a sister agency to RMA, mapped the location of every field to the common land unit (CLU) level. [A CLU is an individual contiguous farming parcel.] To accomplish this, more than 2,500 field service centers across the country were equipped with GIS.
At the start of a growing season, farmers report their planting intentions through acreage reports. Field boundaries from these reports are compiled into a database. Over nearly a decade, more than 36 million CLU boundaries have been recorded along with the associated land ownership, soil, and crop type.
These digital records, which replace paper maps, can be easily updated and analyzed to visualize agricultural trends. They let investigators ask location questions related to claims and speed processing of insurance payments after disaster strikes. Having digital records at the CLU level was a big improvement in geospatial awareness, but it required more computational power.
A Data Science Partner
To handle big data processing at scale, the USDA works with the Center for Agribusiness Excellence at Tarleton State University in Texas. “We leverage the advanced analytics from the university effort to better understand the integrity of a policy, and to seek out waste, fraud, and abuse,” Hipple said.
By adding tabular data to the map, crop insurance compliance investigators can spot patterns and irregularities that indicate potential insurance problems. The key, according to Troy Thorne, director of the Center for Agribusiness Excellence at Tarleton State University, is in identifying inefficiencies—places where the connection between the land and what it produces seems odd or unusual.
Thorne cited the practice of yield switching as an example. Crop insurance is based on a field’s yield history. If a field has produced the same crop with the same farming practices for three years, insurers average the output to determine an approved yield history. That figure becomes the baseline for insurance claims.
To raise the baseline, a farmer might record the accurate overall yield total for all fields but move the numbers around to inflate one field’s total, thus raising that field’s yield history. When that field produces a normal yield the next year, it will appear to have underperformed, providing the basis for a potential insurance claim.
“Yield switching is a big deal,” Thorne said. “You improve the outcome of your insurance claim without actually suffering the losses.”
The ability to see all related data on a map rather than in a tabular format has helped analysts and investigators find incidents of yield switching and other anomalies.
“As a tabular perspective, it kind of gets lost in the detail,” Thorne said. “But when you add the geospatial layer and drop these things on a map, you can look at historical yields, and see that the farmer’s yields are constantly fluctuating.”
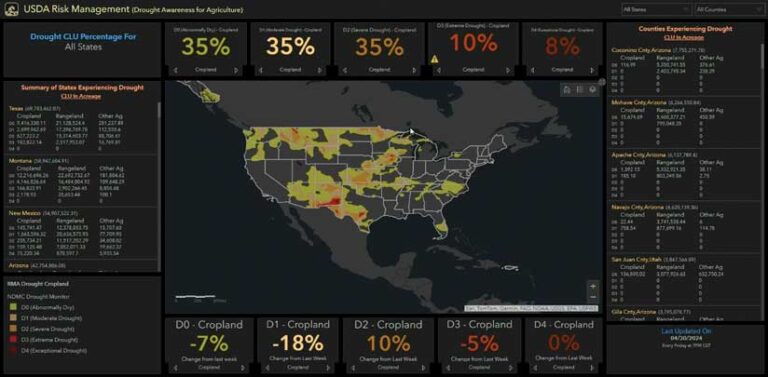
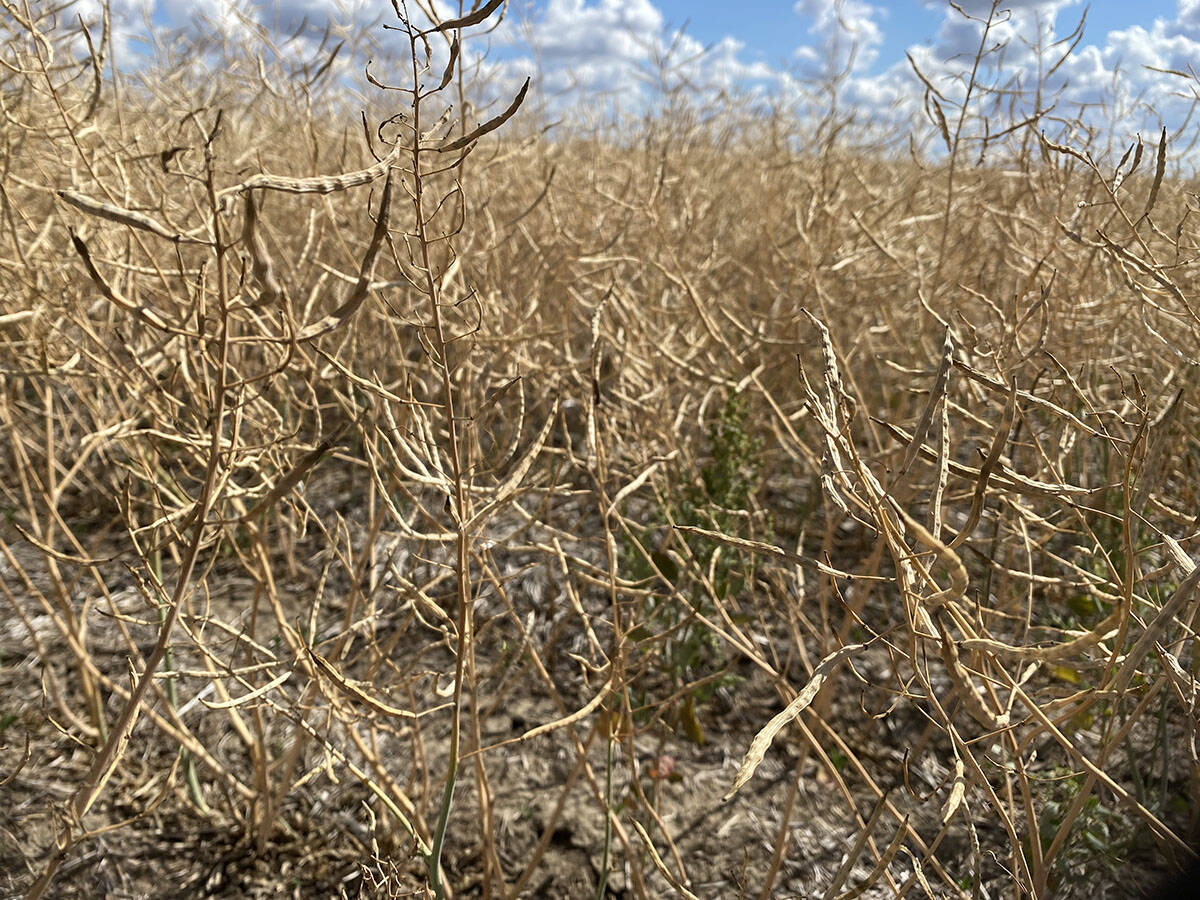
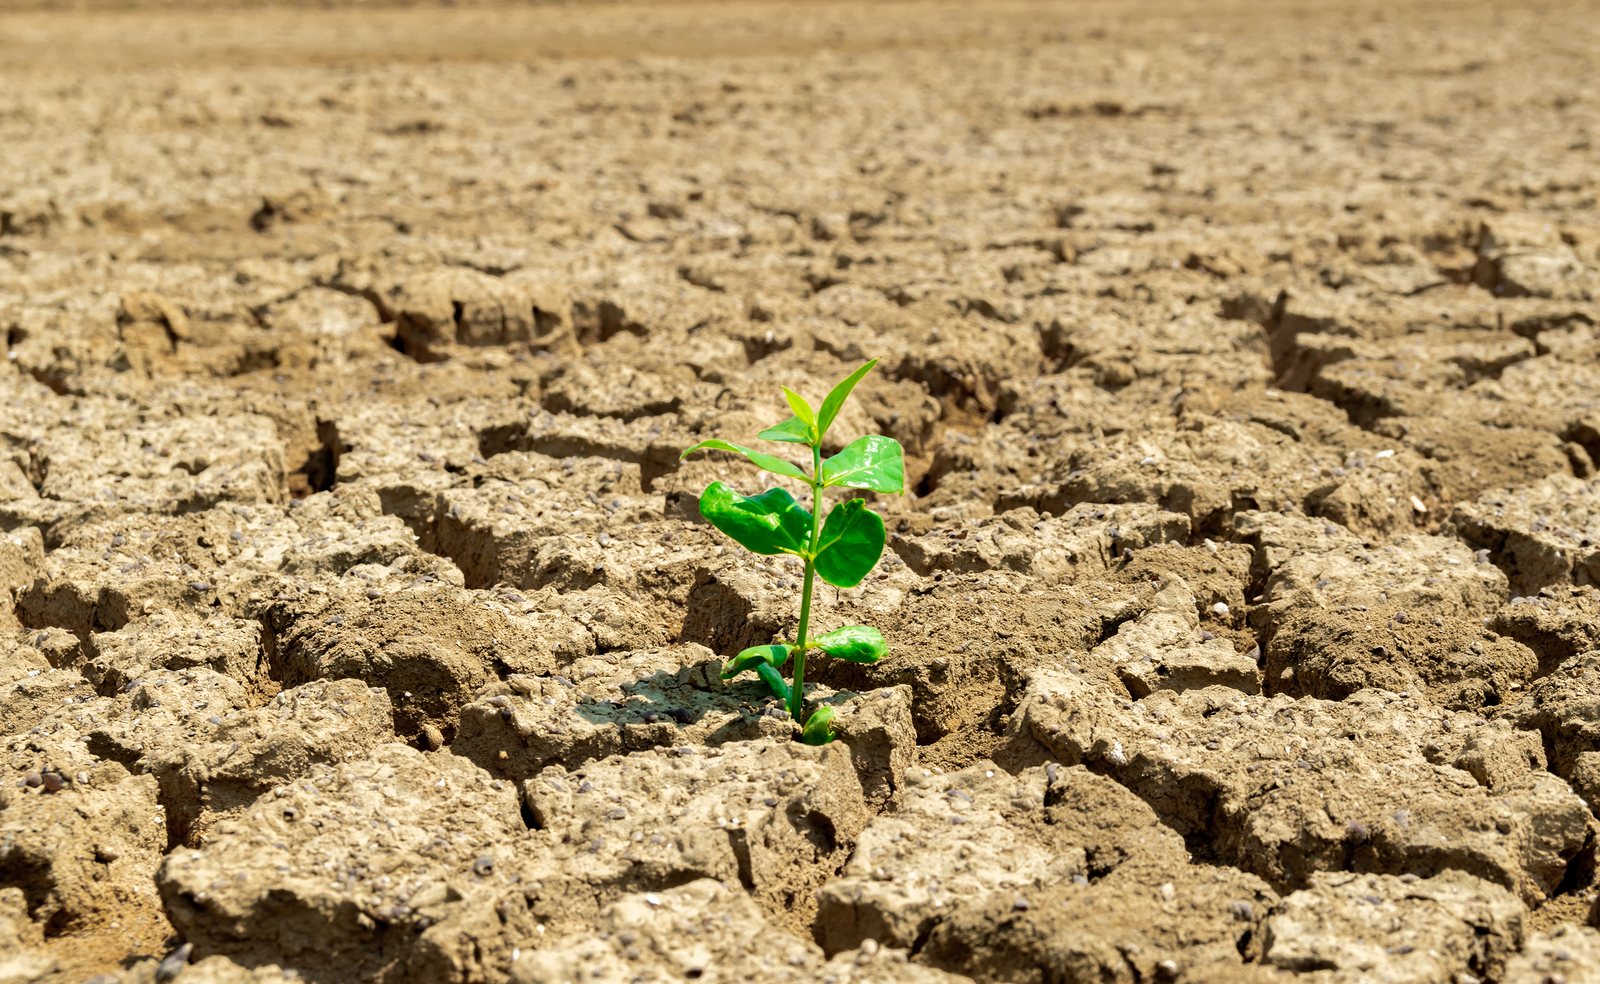
GIS helps the USDA Risk Management Agency investigators monitor conditions such as drought.
Climate Adaptation Strategy
The Tarleton Analytics Institute, part of the Center for Agribusiness Excellence at Tarleton State University in Texas, is one of two contractors RMA employs to examine crop insurance claims. Tarleton’s expertise in data science has helped RMA save millions of dollars each year.
The center’s director, Troy Thorne, has embraced GIS for its ability to “pinpoint areas on a map and examine different layers to not only understand our own results but to identify what’s being impacted, why it’s important, and to get the message across.”
Tarleton has been helping migrate RMA’s systems to the cloud to meet the federal government’s cloud-first pledge. At RMA, cloud-based processing is listed as part of the agency’s Climate Adaptation Plan to reduce the risk of disaster events damaging its systems. Distributed computing is just one adaptation strategy the agency employs to harden its infrastructure.
For farmers, Thorne sees a need for more data-driven decision-making. “Having geospatial and weather data at your fingertips will help farmers make better decisions,” he said. “As we continue to see our farmland diminish, it’s imperative that we help farmers address these challenges.” USDA recently updated the federal crop insurance program to include conservation and climate-smart activities such as good farming practices. These practices promote the conservation of soil, water, air, animals, and energy resources.
Source - ESRI