USA - A historic year for billion-dollar weather and climate disasters
In 2016, the U.S. experienced 15 weather and climate disasters with losses exceeding $1 billion, causing a total of $46.0 billion in damages. This was the second highest number of billion-dollar events in the 37-year record (1980-2016), one less than the 16 events that occurred in 2011.
Four of these were inland flooding events not associated with named tropical storms, doubling the previous record for number of billion-dollar inland flood events in one year, which occurred several years, most recently in 2015. This is a notable record, further highlighted by the numerous other record flooding events that have impacted the U.S. in 2016...
Full summary:
NOAA’s National Centers for Environmental Information (NCEI) tracks U.S. weather and climate events that have great economic and societal impacts (www.ncdc.noaa.gov/billions). Since 1980, the U.S. has sustained 203 weather and climate disasters where the overall damage costs reached or exceeded $1 billion (including CPI adjustments, as of January 2017). The cumulative costs for these 203 events exceeds $1.1 trillion.
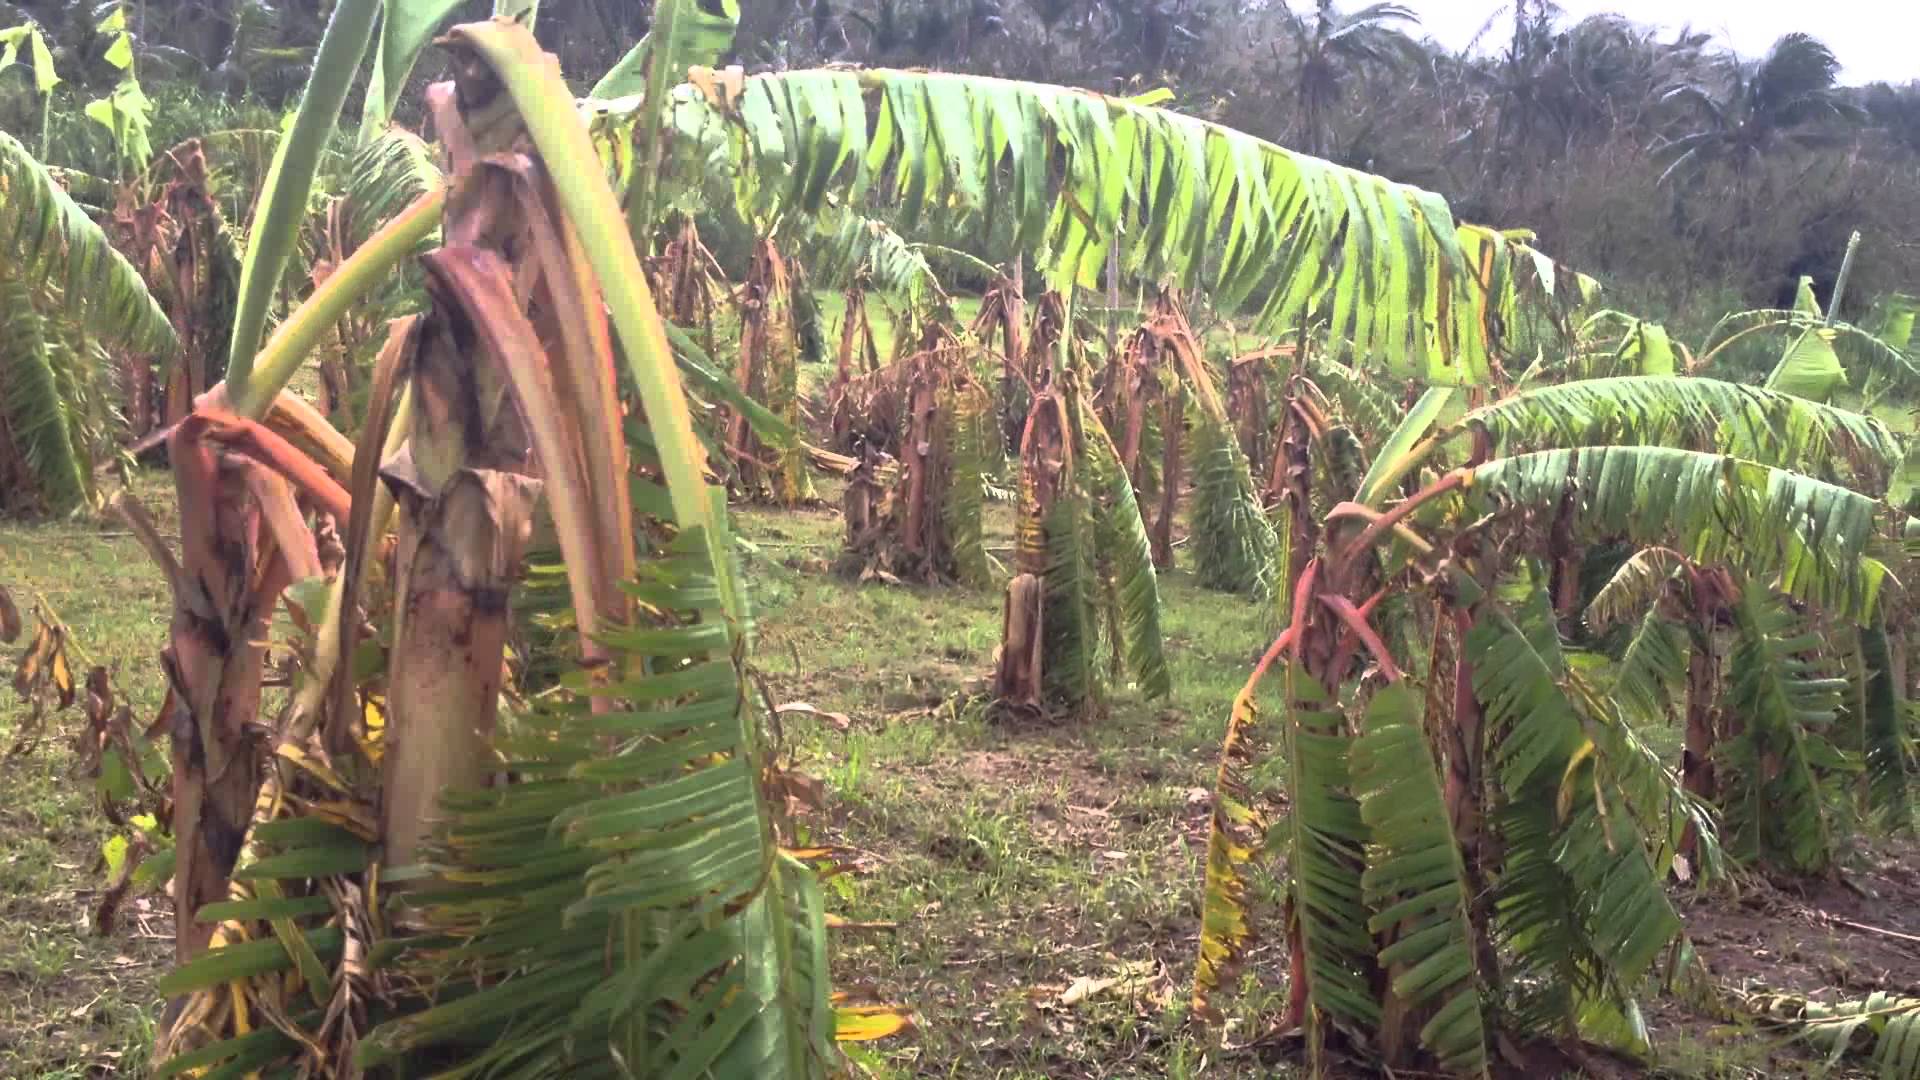
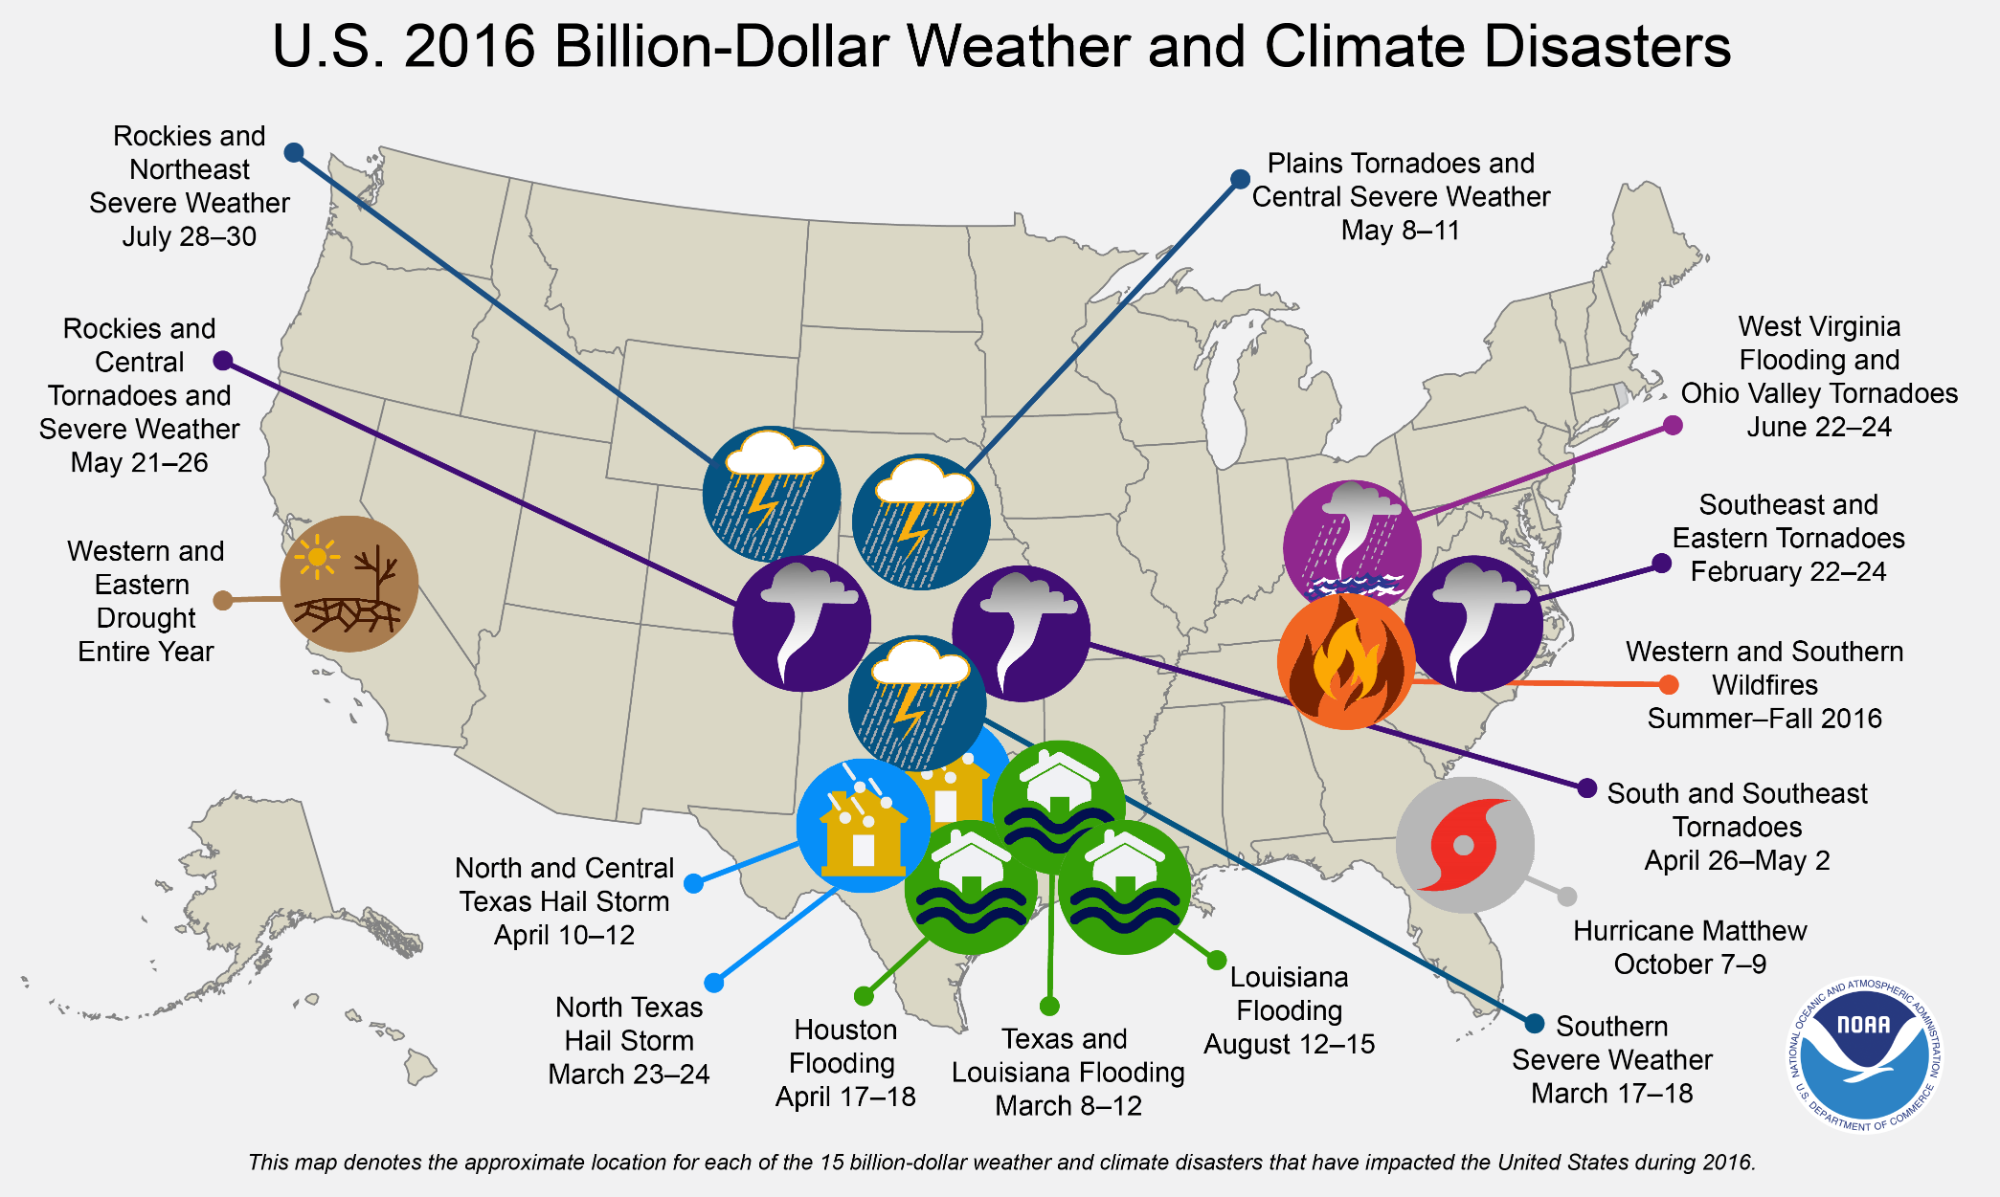
The year 2016 was an unusual year, as there were 15 weather and climate events with losses exceeding $1 billion each across the United States. These events included drought, wildfire, 4 inland flood events, 8 severe storm events and a tropical cyclone event (see map below). Cumulatively, these 15 events caused $46.0 billion in total, direct costs and led to 138 fatalities. 2016 observed the 2nd highest annual total of U.S. billion-dollar disasters behind the 16 events that occurred in 2011.
Perhaps most surprising were the 4 separate billion-dollar inland flood (i.e., non-tropical) events during 2016, doubling the previous record, as no more than 2 inland flood events have occurred in a year since 1980. Three of these flood events were clustered in Louisiana and Texas between March and August, collectively causing damage approaching $15.0 billion. This is a notable record, further highlighted by the numerous other record flooding events that impacted the U.S. in 2016.
The changing frequency of billion-dollar disaster events:
The U.S. has experienced a rising number of events that cause significant amounts of damage. From 1980–2016, the annual average number of billion-dollar events is 5.5 (CPI-adjusted). For the most recent 5 years (2012–2016), the annual average is 10.6 events (CPI-adjusted). The year 2005 was the most costly since 1980 due to the combined impacts of Katrina, Rita, Wilma and Dennis, as shown in the following time-series. The year 2012 was the second most costly due to the extreme U.S. drought ($30 billion) and Superstorm Sandy ($65 billion) driving the losses.
The increase in population and material wealth over the last several decades are an important factor for the increased damage potential. This is further complicated as many population centers and vulnerable infrastructure exist in hazardous areas, while building codes are also insufficient in reducing damage from extreme events.
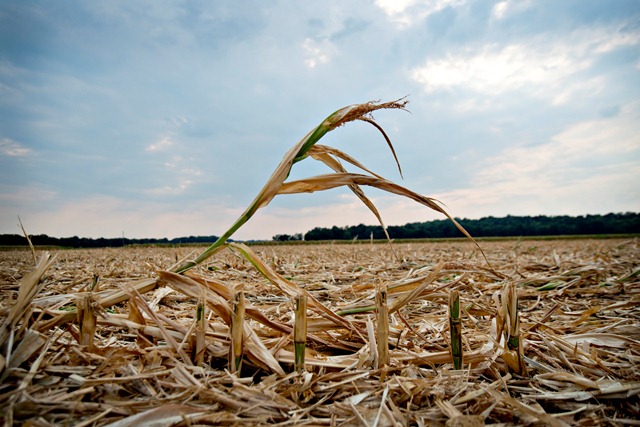
Regarding specific event types, the U.S. has experienced a higher frequency of billion-dollar inland flood events (i.e., non-tropical) in recent years. Perhaps this should not be unexpected, as heavy rainfall events and the ensuing flood risks are increasing due to the fact that warming loads the atmosphere with more water vapor (NCA, 2014). Over time this increases the potential for extreme rainfall events, which we have experienced more of in recent years (e.g., Colorado, Texas, Louisiana, South Carolina, West Virginia, etc.)
Other types of extreme weather events have also shown a higher frequency including the semi-persistent Western drought and wildfire seasons since the year 2000. It has been observed that wildfire seasons are lengthening in the Western states and Alaska (NCA, 2014) while forestry management budgets are increasingly diverted for wildfire suppression costs (USFS, 2015).
In contrast, there have been fewer cold wave / crop freeze events and destructive winter storm events, which were more frequent in the 1980s and 1990s. It is worth noting that in recent decades, the ratio of broken U.S. record high vs. record low temperatures has been dominated by new record highs, with far fewer record lows (NCAR, 2016; NCEI, 2017). However, trends in winter storm event intensity are subject to more uncertainty than only temperature.
Since 1980, landfalling tropical cyclones have been intermittent but are highly destructive. These impacts will only become more costly, as population and wealth continues to concentrate along our coasts. Severe local storm impacts (i.e., tornado, hail, straight-line winds) have risen in recent years but long-term trends in these events are subject to greater uncertainties (Tippet et al., 2016).
The frequency of disaster events by type:
The distribution of damage from U.S. Billion-dollar disaster events across the 1980-2016 period of record (as of January 2017, CPI-adjusted) is dominated by tropical cyclone losses. The following table highlights that landfalling tropical cyclones have caused the most damage ($560.1 billion) and have the highest average event cost ($16.0 billion / event).
Drought ($223.8 billion), severe storms ($180.1 billion) and inland flooding ($110.7 billion) have also caused considerable damage based on the list of billion-dollar events. It is of note that severe storms are responsible for the highest number of billion-dollar disaster events (83) yet the average event cost is the lowest ($2.2 billion) but still substantial. Tropical cyclones and flooding represent the second and third most frequent event types (35 and 26), respectively.
Tropical cyclones are also responsible for the highest number of deaths (3,210), followed by drought/heatwave events (2,993) and severe storms (1,546).
The spatial distribution of disaster events by type:
The U.S. is weather and climate conscious for good reason, as each geographic region faces a unique combination of persistent hazards. The maps below reflect the frequency of the billion-dollar disaster events impacting each state (i.e., does not mean that each state shown has suffered $1 billion in losses for each event).
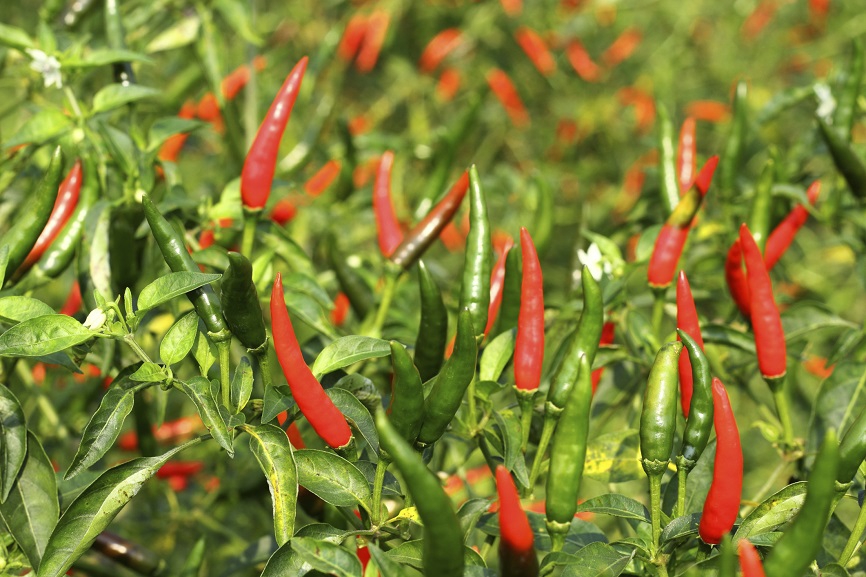
Each disaster type has a distinct footprint of impact over time. We see wildfire impacts largely west of the Plains states including a few Southeast impacts. The high frequency inland flooding events often occur in states adjacent to large rivers or the Gulf of Mexico, which is a warm source of moisture to fuel rainstorms. Drought impacts are most focused in the Southern and Plains states where there are billions of dollars in agriculture and livestock assets.
Severe local storm events are common in the Plains and into the Ohio River Valley states. Winter storm impacts are concentrated in the northeast given the propensity for Nor’easters while tropical cyclone impacts range from Texas to New England but also impact many inland states.
In total, from 1980–2016, the U.S. South/Central and Southeast regions experienced a higher frequency of billion-dollar disaster events than any other region, as shown in the red total disaster map. This map reflects the cumulative diversity, frequency, & severity of weather & climate events impacting these regions.
Source - https://www.linkedin.com