ANALYTICS
1
of 4
Analytics
25.10.2022

A Practical Method for Adjusting the Premium Rates in Crop-Hail Insurance with Short-Term Insurance Data

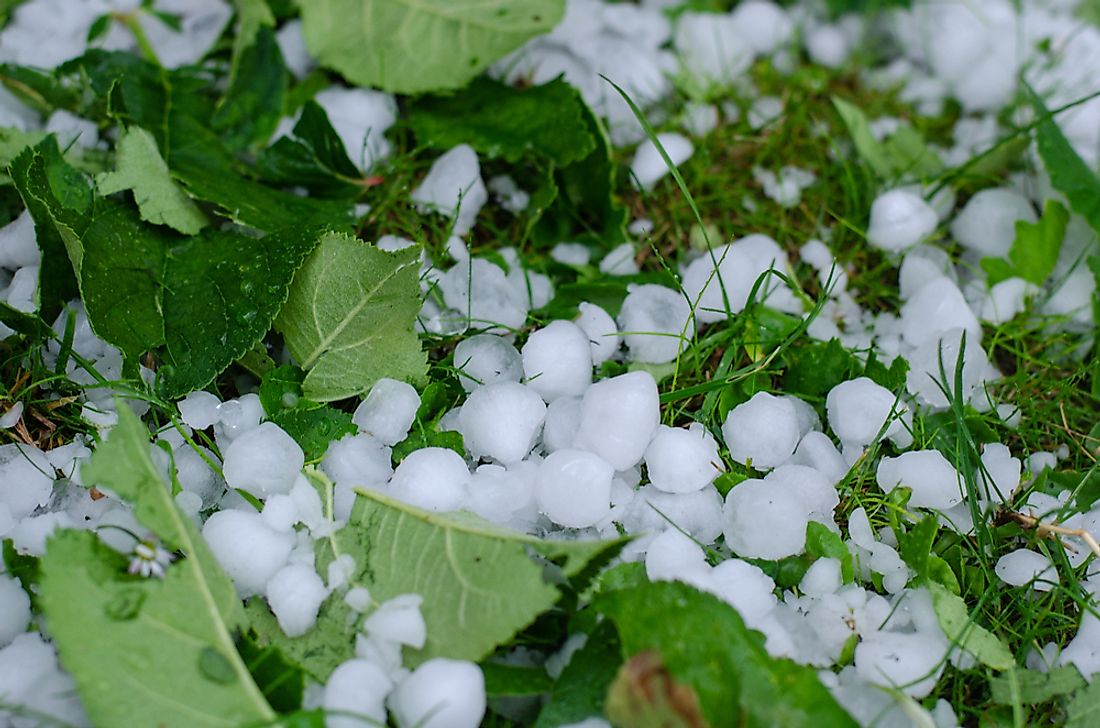
The frequency of hailstorms is generally low in small geographic areas. In other words, it may be very likely that hailstorm occurrences will vary between neighboring locations within a short period of time. Besides, a newly launched insurance scheme lacks the data. It is, therefore, difficult to sustain a sound insurance program under these circumstances, with premium rates based on meteorological data without a complimentary adjustment process.

18.10.2019

Malta - Vegetable production dropped 7% in 2018

Last year, Malta’s local vegetable produce dropped by 7% when compared to the previous year. The total vegetables produced in tonnes amounted to 58,178, down by 7% when compared to 2017. Their value too diminished as the total produce was valued at €30 million, down by 13% over the previous year. The most significant drop was in potatoes, down by 27% over the previous year. Tomatoes and onions were the only vegetables to have increased in volume, by 3% and 4% respectively but their value diminished by 9% and 24% respectively. The figures were published by the National Statistics Office on the event of World Food Day 2019, which will be celebrated on Wednesday. Cauliflower, cabbage and lettuce produce dropped by 10%, 3%, and 12% respectively. In the realm of local fruit, a drop of produce was registered here too apart from strawberries, which experienced a whopping increase of 58% over 2017. Total fruit produced in 2018 amounted to 13,057 tonnes, down by 1% when compared to 2017. The total produce was valued at €10 million, a 3% increase in value. Peaches produced were down by 35% and the 376 tonnes of peaches cultivated amounted to €0.5 million in value. Orange produce dropped by 10% and lemon produce dropped by 14%. There was no change in the amount of grapes produced and the 3,642 tonnes of grapes produced in 2018 were valued at €2.3 million. 70% of fruit and vegetables consumed in Malta is imported. The drop in local produce could be the result of deleterious or unsuitable weather patterns. Source - https://www.freshplaza.com

07.10.2019

USA - Greenhouse tomato production spans most states

While Florida and California accounted for 76 percent of U.S. production of field-grown tomatoes in 2016, greenhouse production and use of other protected-culture technologies help extend the growing season and make production feasible in a wider variety of geographic locations. Some greenhouse production is clustered in traditional field-grown-tomato-producing States like California. However, high concentrations of greenhouses are also located in Nebraska, Minnesota, New York, and other States that are not traditional market leaders. Among the benefits that greenhouse tomato producers can realize are greater market access both in the off-season and in northern retail produce markets, better product consistency, and improved yields. These benefits make greenhouse tomato production an increasingly attractive alternative to field production despite higher production costs. In addition to domestic production, a significant share of U.S. consumption of greenhouse tomatoes is satisfied by imports. In 2004, U.S., Mexican, and Canadian growers each contributed about 300 million pounds of greenhouse tomatoes annually to the U.S. fresh tomato market. Since then, Mexico’s share of the greenhouse tomato market has grown sharply, accounting for almost 84 percent (1.8 billion pounds) of the greenhouse volume coming into the U.S. market. Source - https://www.freshplaza.com

03.10.2019

World cherry production will decrease to 3.6 million tons

According to information from the USDA for the 2019-2020 season, world cherry production is expected to decrease slightly and amount to 3.6 million tons. This decline is due to the damages that the weather caused on cherry crops in the European Union. Even though Chile is expected to achieve a record export, world trade in cherries is expected to drop to 454,000 tons, based on lower shipments from Uzbekistan and the US. Turkey Turkey's production is expected to increase to 865,000. As a result of the strong export demand, producers continue to invest and improve their orchards, switching to high yield varieties and gradually expanding the surface for sweet cherries. More supplies are expected to increase exports to a record 78,000 tons, continuing its long upward trend. Chile Chile's production is forecast to increase from 30,000 tons to 231,000 as they have a larger area of mature trees. Between 2009/10 and 2018/19, the crop area has almost tripled, a trend that is expected to continue. The country is expected to export up to 205,000 tons in higher supplies. The percentage of exports destined for China has increased from 13 to almost 90% since 2009/10. China China's production is expected to increase by up to 24% and to amount to 420,000 tons, due to the recovery of the orchards that were damaged by frost last year. In addition, there are new crops that will go into production. Imports are expected to increase by 15,000 tons and to stand at 195,000 tons, as the increase in supplies from Chile will more than compensate for the lower shipments from the United States. Although higher tariffs are maintained for American cherries, the United States is expected to remain China's main supplier in the northern hemisphere. United States US production is expected to remain stable at 450,000 tons. Imports are expected to increase to 18,000 tons with more supplies available from Chile. Exports are forecast to decrease for the second consecutive year to 80,000 tons, as high retaliatory tariffs continue to suppress US shipments to China. If this happens, it will be the first time that US cherry exports experience a decrease in 2 consecutive years since 2002/03, when production suffered a fall of 44%. European Union EU production is projected to fall by more than 20%, remaining at 648,000 tons because of the hail that affected the early varieties in Italy, and the frost, low temperatures, and drought that caused a significant loss of fruit in Poland, the main producer. Lower supplies are expected to pressure exports to 15,000 tons and increase imports to 55,000 tons. Russia Russia's imports are expected to contract by 13,000 tons to 80,000 with lower supplies from Kazakhstan, Moldova, and Serbia. Source - https://www.freshplaza.com

09.08.2019

EU - 20% fewer apples and 14% fewer pears than last year

This year's European apple production is expected to come to 10,556,000 tons. That is 20% less than last year. It is also 8% less than the average over the past three years. The European pear harvest is expected to be 2,047,000 tons. This is 14% lower than last year and 9% less than the previous three seasons average. These figures are according to the World Apple and Pear Association, WAPA's top fruit prognoses. They presented their report at Prognosfruit this morning. Apple harvest per country Poland is Europe's apple-growing giant. This country is expected to process 44% fewer apples. The yield is expected to be 2,710,000 tons. Last year, this was still 4,810,000 tons. In Italy, yields are only three percent lower than last year. According to WAPA, this country will have an apple harvest of 2,195,000 tons. France takes third place. They will even have 12% more apples than last year to process - 1,652,000 tons. Pear harvest per country With 511,000 tons, Italy's pear harvest is much lower than last year. It has dropped by 30%. In terms of the average over the previous three seasons, this fruit's yield is 29% lower. In the Netherlands, the pear harvest is expected to be six percent lower, at 379,000 tons. This volume is still 3% more than the average over the last three years. Belgium has 10% fewer pears (331,000 tons) than last year. They are just ahead of Spain. With 311,000 tons, Spain who will harvest four percent more pears. Apple harvest per variety The Golden Delicious remains, by far, the largest apple variety in Europe. It is expected that 2,327,000 tons of these apples will be harvested this year. This is three percent less than last year. At 1,467,000 tons, Gala estimations are exactly the same as last year. The European Elstar harvest will also be roughly equivalent to last year. A volume of 355,000 tons of this variety is expected. Pear harvest per variety Looking at the different varieties, the European Conference is estimated to be 8% lower than last year. A volume of 910,000 tons is expected. The low Italian pear estimate will result in 34% fewer Abate Fetel pears (211,000 tons) being available. This is according to WAPA's estimate. This makes this variety smaller than the Williams BC (230.000 ton) in Europe. Source - https://www.freshplaza.com

30.01.2018

Spring frost losses and climate change not a contradiction in terms - Munich Re

Between 17 April and 10 May 2017, large parts of Europe were hit by a cold snap that brought a series of overnight frosts. As the budding process was already well advanced due to an exceptionally warm spring, losses reached historic levels – particularly for fruit and wine growers: economic losses are estimated at €3.3bn, with around €600m of this insured. In the second and third ten-day periods of April, and in some cases even over the first ten days of May 2017, western, central, southern and eastern Europe experienced a series of frosty nights, with catastrophic consequences in many places for fruit growing and viticulture. The worst-affected countries were Italy, France, Germany, Poland, Spain and Switzerland. Losses were so high because vegetation was already well advanced following an exceptionally warm spell of weather in March that continued into the early part of April. For example, the average date of apple flowering in 2017 for Germany as a whole was 20 April, seven days earlier than the average for the period 1992 to 2016. In many parts of Germany, including the Lake Constance fruit-growing region, it even began before 15 April. In the case of cherry trees – whose average flowering date in Germany in 2017 was 6 April – it was as much as twelve days earlier than the long-term average. The frost had a devastating impact because of the early start of the growing season in many parts of Europe. In the second half of April, it affected the sensitive blossoms, the initial fruiting stages and the first frost-susceptible shoots on vines. Meteorological conditions The weather conditions that accounted for the frosty nights are a typical feature of April, and also the reason for the month’s proverbial reputation for changeable weather. The corridor of fast-moving upper air flow, also known as the polar front, forms in such a way that it moves in over central Europe from northwesterly directions near Iceland. This north or northwest pattern frequently occurs if there is high air pressure over the eastern part of the North Atlantic, and lower air pressure over the Baltic and the northwest of Russia. Repeated low-pressure areas move along this corridor towards Europe, bringing moist and cold air masses behind their cold fronts from the areas of Greenland and Iceland. Occasionally, the high-pressure area can extend far over the continent in an easterly direction. The flow then brings dry, cold air to central Europe from high continental latitudes moving in a clockwise direction around the high. It was precisely this set of weather conditions with its higher probability of overnight frost that dominated from mid-April to the end of the month. There were frosts with temperatures falling below –5°C, in particular from 17 to 24 April (second and third ten-day periods of April), and even into the first ten-day period of May in eastern Europe. The map in Fig. 2 shows the areas that experienced night-time temperatures of –2°C and below in April/May. High losses in fruit and wine growing Frost damage to plants comes from intracellular ice formation. The cell walls collapse and the plant mass then dries out. The loss pattern is therefore similar to what is seen after a drought. Agricultural crops are at varying risk from frost in the different phases of growth. They are especially sensitive during flowering and shortly after budding, as was the case with fruit and vines in April 2017 due to the early onset of the growing season. That was why the losses were so exceptionally high in this instance. In Spain, the cold snap also affected cereals, which were already flowering by this date. Even risk experts were surprised at the geographic extent and scale of the losses (overall losses: €3.3bn, insured losses: approximately €600m). Overall losses were highest in Italy and France, with figures of approximately a billion euros recorded in each country. Two basic concepts for frost insurance As frost has always been considered a destructive natural peril for fruit and wine growing and horticulture, preventive measures are widespread. In horticulture, for example, plants are cultivated in greenhouses or under covers, while in fruit growing, frost-protection measures include the use of sprinkler irrigation as well as wind machines or helicopters to mix the air layers. Just how effective these methods prove to be will depend on meteorological conditions, which is precisely why risk transfer is so important in this sector. There are significant differences between one country and the next in terms of insurability and insurance solutions. But essentially there are two basic concepts available for frost insurance: indemnity insurance, where hail cover is extended to include frost or other perils yield guarantee insurance covering all natural perils In most countries, the government subsidises insurance premiums, which means that insurance penetration is higher. In Germany, where premiums are not subsidised and frost insurance density is low, individual federal states like Bavaria and Baden-Württemberg have committed to providing aid to farms that have suffered losses – including aid for insurable crops such as wine grapes and strawberries. Late frosts and climate change There are very clear indications that climate change is bringing forward both the start of the vegetation period and the date of the last spring frost. Whether the spring frost hazard increases or decreases with climate change depends on which of the two occurs earlier. There is thus a race between these two processes: if the vegetation period in any given region begins increasingly earlier compared with the date of the last spring frost, the hazard will increase over the long term. If the opposite is the case, the hazard diminishes. Because of the different climate zones in Europe, the race between these processes is likely to vary considerably. Whereas the east is more heavily influenced by the continental climate, regions close to the Atlantic coastline in the west enjoy a much milder spring. A study has shown that climate change is likely to significantly reduce the spring frost risk in viticulture in Luxembourg along the River Moselle1. The number of years with spring frost between 2021 and 2050 is expected to be 40% lower than in the period 1961 to 1990. By contrast, a study on fruit-growing regions in Germany2 concluded that all areas will see an increase in the number of days with spring frost, especially the Lake Constance region, where reduced yields are projected until the end of this century. At the same time, however, only a few preliminary studies have been carried out on this subject, so uncertainty prevails. Outlook The spring frost in 2017 illustrated the scale that such an event can assume, and just how high losses in fruit growing and viticulture can be. Because the period of vegetation is starting earlier and earlier in the year as a result of climate change, spring frost losses could increase in the future, assuming the last spring frost is not similarly early. It is reasonable to assume that these developments will be highly localised, depending on whether the climate is continental or maritime, and whether a location is at altitude or in a valley. Regional studies with projections based on climate models are still in short supply and at an early stage of research. However, one first important finding is that the projected decrease in days with spring frost does not in any way imply a reduction in the agricultural spring frost risk for a region. So spring frosts could well result in greater fluctuations in agricultural yields. In addition to preventive measures, such as the use of fleece covers at night, sprinkler irrigation and the deployment of wind machines, it will therefore be essential to supplement risk management in fruit growing and viticulture with crop insurance that covers all natural perils. Source - ttps://www.munichre.com/

17.05.2014

Russia Livestock Overview: Cattle, Swine, Sheep & Goats

Private plots generate 48 percent of cattle, 43 percent of swine and 54 percent of sheep and goats in Russia.  The Russian government recently approved a new program that will succeed the National Priority Project in agriculture (NPP) titled, “TheState Program for Development of Agriculture and Regulation of Food and Agricultural Markets in 2008-2012,” that encourages pork and beef production and attempts to address Russia’s declining cattle numbers.  This program includes import-substitution policies designed to stimulate domestic livestock production and to protect local producers. In the beginning of 2007, the economic environment for swine production was generally unfavorable.  The average production cost was RUR40-45/kilo of live weight, while the farm gate price was RUR40/kilo live weight.  Pork producers have been expressing concern for years about sales after implementation of the NPP as pork consumption is growing at a slower rate than pork production.  As a result, the pork sector has been lobbying the Russian government to regulate imports in spite of the meat TRQ agreement. From January-September 2007, 1.38 million metric tons (MMT) of red meat was imported.  A 12-year decline in beef production has resulted in limited beef availability in the Russian market leading to a spike in prices.  In response, the Russian government has been force to take steps to increase the availability of beef by lifting a meat ban on Poland and by looking to Latin America for higher volumes of product.  Feed stocks decreased during the first 11 months of 2007 compared to the previous year which will likely create even greater financial problems for livestock operations in 2008 as feed prices continue to skyrocket.  Grain prices increased rapidly in Russia through the middle of July 2007 before stabilizing at high levels as harvest progress reports were released. The Russian pig crop is expected to increase by 6 percent in 2008, while cattle herds are predicted to decrease by 3.5 percent.  Some meat market analysts predict that by 2012, as new and modernized pig farming complexes reach planned capacity, pork production could reach 3.5 MMT – up 75 percent from 2008 estimates. According to the Russian Statistics Agency (Rosstat), 1/3 of all Russian “large farms” are unprofitable.  Many of these are involved in livestock production.  Small, inefficient producers are uncompetitive and have already begun disappearing from the market. The Russian veterinary service continues to playa decisive role in meat import supply management. Source - http://www.cattlenetwork.com

27.11.2012

Statistics Canada : Farm income, 2011

Realized net income for Canadian farmers amounted to $5.7 billion in 2011, a 53.1% increase from 2010. This rise followed a 19.0% increase in 2010 and a 19.6% decline in 2009. Realized income is the difference between a farmer's cash receipts and operating expenses, minus depreciation, plus income in kind. Realized net income fell in four provinces: Newfoundland and Labrador, Nova Scotia, Manitoba and British Columbia. In each, increases in costs outpaced gains in receipts. Farm cash receipts Farm cash receipts, which include market receipts from crop and livestock sales as well as program payments, rose 11.9% to $49.8 billion in 2011. This was the first increase since 2008. Market receipts alone increased 12.0% to $46.3 billion. Crop receipts, which increased 15.8% to $25.9 billion, contributed the most to the increase. Sales from livestock products rose 7.5% to $20.3 billion, the largest annual increase since 2005. Stronger prices for grains and oilseeds played a major role in the increase in crop revenues. For example, canola receipts increased 37.3% in 2011 on the strength of a 27.3% gain in prices. Grains and oilseed prices started rising in the last half of 2010 as a result of limited global stocks and strong demand. Even though prices peaked in mid-2011, prices for the year, on average, remained well above 2010 levels. Crop receipts rose in every province except Manitoba and Newfoundland and Labrador. In Manitoba, difficult growing conditions reduced marketings of most grains and oilseeds. In Prince Edward Island and New Brunswick, increases in potato prices and marketings helped push crop receipts higher. It was also stronger prices that were behind the rise in livestock receipts. Hog receipts increased 15.5% to $3.9 billion on the strength of a 14.7% price increase. Cattle prices rose 19.5% in 2011, while receipts increased 1.1% because of a reduced supply of market animals. Hog, cattle and calf prices increased in 2010. The upward trend continued throughout most of 2011, primarily because of low North American inventories and high feed grain costs. Receipts for producers in the three supply-managed sectors-dairy, poultry and eggs-increased 7.9% as rising prices reflected higher costs for feed grain and other production inputs. A 14.9% rise in chicken receipts exceeded increases for eggs (+8.7%) and dairy products (+5.3%). Program payments increased 11.2% to $3.5 billion in 2011. Increases in Quebec provincial stabilization payments as well as crop insurance payments in Manitoba and Saskatchewan accounted for much of the rise. Farm expenses Farm operating expenses (after rebates) were up 8.4% to $38.3 billion in 2011, the second-largest percentage increase since 1981. This increase followed two consecutive years of modest declines. Higher prices for fertilizer, feed and machinery fuel contributed to the increase in operating expenses. According to the Farm Input Price Index, both fertilizer and machinery fuel prices were up by over 25% in 2011. At the same time, feed grain prices increased by more than 30%. When depreciation charges were included, total farm expenses increased 8.2% to $44.1 billion. Depreciation costs rose 6.9%. Total farm expenses advanced in every province in 2011. The largest percentage increases occurred in Saskatchewan (+12.3%), Quebec (+9.5%) and Alberta (+9.0%). Total net income Total net income reached $5.8 billion, a $3.3 billion gain. There were large increases in Saskatchewan (+$2.1 billion), Alberta (+$567 million) and Ontario (+$470 million), while Newfoundland and Labrador, New Brunswick and Manitoba saw declines. Total net income adjusts realized net income for changes in farmer-owned inventories of crops and livestock. It represents the return to owner's equity, unpaid labour, and management and risk. The total value of farm-owned inventories rose by $165 million in 2011. A strong increase in deferred grain payments together with the first increase in cattle inventories since 2004 contributed to the rise. Note to readersRealized net income can vary widely from farm to farm because of several factors, including commodities, prices, weather and economies of scale. This and other aggregate measures of farm income are calculated on a provincial basis employing the same concepts used in measuring the performance of the overall Canadian economy. They are a measure of farm business income, not farm household income. Financial data for 2011 collected at the individual farm business level using surveys and other administrative sources will soon be tabulated and made available. These data will help explain differences in performance of various types and sizes of farms. For details on farm cash receipts for the first three quarters of 2012, see today's "Farm cash receipts" release. As a result of the release of data from the 2011 Census of Agriculture on May 10, 2012, data on farm cash receipts, operating expenses, net income, capital value and other data contained in the Agriculture Economic Statistics series are being revised, where necessary. The complete set of revisions will be released in the November 26, 2013, edition of The Daily. Table 1 Net farm income 2009 2010r 2011p 2009 to 2010 2010 to 2011 millions of dollars % change + Total farm cash receipts including payments 44,599 44,466 49,772 -0.3 11.9 - Total operating expenses after rebates 36,052 35,315 38,276 -2.0 8.4 = Net cash income 8,547 9,151 11,496 7.1 25.6 + Income-in-kind 39 40 45 2.6 11.1 - Depreciation 5,471 5,483 5,864 0.2 6.9 = Realized net income 3,115 3,709 5,677 19.0 53.1 + Value of inventory change -281 -1,157 165 ... ... = Total net income 2,834 2,551 5,842 ... ... Table 2 Net farm income, by province Canada Newfoundland and Labrador Prince Edward Island Nova Scotia New Brunswick Quebec millions of dollars 2010r + Total farm cash receipts including payments 44,466 118 407 500 479 7,171 - Total operating expenses after rebates 35,315 106 367 422 406 5,472 = Net cash income 9,151 12 41 78 73 1,699 + Income-in-kind 40 0 0 1 1 10 - Depreciation 5,483 8 41 59 54 727 = Realized net income 3,709 4 0 19 20 983 + Value of inventory change -1,157 -0 18 0 9 13 = Total net income 2,551 4 18 19 29 996 2011p + Total farm cash receipts including payments 49,772 120 477 527 533 7,967 - Total operating expenses after rebates 38,276 114 391 448 424 6,018 = Net cash income 11,496 6 86 79 109 1,949 + Income-in-kind 45 0 0 1 1 11 - Depreciation 5,864 9 43 62 55 767 = Realized net income 5,677 -2 43 18 55 1,194 + Value of inventory change 165 -0 -12 2 -50 -24 = Total net income 5,842 -3 31 20 5 1,170 Source - http://www.4-traders.com/

23.02.2012

Ukraine - Information on Crop Insurance in Spring-Autumn 2011

Download file with graphs >>> Throughout spring-summer 2011, the insurance companies signed 1,981 crop insurance contracts (750 contracts in 2010). Our database does not distinguish between the types of contracts for spring-autumn as these contracts were less standardised than the contracts providing coverage for the winter season.  Normally, the insurers allowed producers to select a limited coverage (i.e. selected perils). This reduces the cost of insurance, especially if the client wishes to insure only against some predetermined risks. Throughout spring-autumn 2011, 540,000 hectares were insured (340,000 in 2010). The total sum insured was nearly UAH 3.2 b. (UAH 1.6 b. in 2010). The total premiums amounted to UAH 108 million (UAH 57.7 million in 210). The average premium rate was 3.38%, i.e. somewhat lower than in 2010 (3.59%). The forward grain purchase programme of the KhlibInvestBud Company in the grain market was the major factor contributing to the development of agri-insurance. All producers participating in the programme had to insure the yield with one of the three accredited companies (ASKA, Brokbuisness or Providna). Consequently, these three companies collected over 47% of all premiums in the market in spring-autumn 2011 and insured 264,000 hectares, e.g. 49% of the total acreage insured in the 2011 season.  The average insurance rates of these companies were at the level of the market average rate. That may be seen as an indicator that KhlibInvestBud required the producers to have real insurance coverage (which is often not the case when crops are insured as collateral). According to the insurance companies, the average premium rate on bank pledged crops insured in spring-autumn 2011 was only 1.29%. The insurance companies could not provide the indemnity data for the time when the data was requested, i.e. the database does not include the indemnity and loss data. These data will be collected at later stages along with the data on winter crops insured during autumn 2012. Crop data The producers preferred to insure winter wheat (1,091 contracts), sugar beets (234 contracts), corn (192 contracts) and winter rye (122 contracts). Fruit trees and grapes were not covered at all.  It should be noted that horticulture insurance is virtually nonexistent in Ukraine. In spring 2011, very few producers purchased vegetable coverage at the rates significantly lower than the average agri-insurance rates in Ukraine. The insured acreage under winter wheat was 284,000 hectares. The producers paid over UAH 44 million under the contracts insuring winter wheat for the summer season. The corn insurance contracts covered some 69,500 hectares and provided for the premiums worth UAH 19.3 million Sugar beets were insured on 55,800 hectares and the producers collected UAH 26.8 million of premiums. The insured acreage under sunflowers was 40,000 hectares (only UAH 4.7 million collected). The key agri-insurance data are given in the table below. Table: Crop insurance data by crop Crop Contracts Including, collateral agreements Acreage, hectares Insured sum, UAH Premiums, UAH Winter wheat 1,091 42 284,156 1,431,197,640 44,356,435 Winter barley 39 9 9,136 21,520,785 348,608 Winter rye 122 1 13,317 38,726,205 1,430,316 Winter triticale 2 2 380 1,368,360 13,478 Winter rapeseed 31 15 12,060 65,866,904 1,011,434 Wheat 6 0 1,890 9,335,331 154,280 Barley 88 1 21,078 64,027,285 3,359,356 Rye 1 0 9,854 30,765,013 1,155,223 Sugar beets 234 3 55,845 735,329,840 26,803,363 Sunflower 98 5 40,137 161,813,125 4,749,494 Rapeseed 2 0 254 1,168,146 165,877 Bea 1 0 32 70,144 905 Soya 54 1 19,615 84,895,368 3,928,492 Vegetables 1 0 11 512,050 8,193 Corn 192 4 69,490 495,640,697 19,339,792 Spring mustard 2 0 627 526,879 23,595 Tomatoes 1 0 663 18,332,454 696,633 Chick pea 2 0 22 125,104 2,551 Buck wheat 13 0 1,140 31,855,050 318,124 Rice 1 0 352 6,588,000 197,640 Total 1,981 83 540,057 3,199,664,378 108,063,789 The average premium rate for winter wheat was 3.1%. Sugar beets were insured at 3.65%, corn – at 3.9% and sunflowers – at 2.94%.  The rapeseed insurance was most expensive – the average rate for two contracts was 14.2%, however it is hardly indicative due to the low number of contacts. In spring 2011, the tomato insurance was most expensive (UAH 1,051 per hectare). It was expensive to insure rapeseed (UAH 653/hectare), rice (UAH 561/hectare) and sugar beets (UAH 480/hectare). Other key features per crop are given in the table below. Table: Average premium rates, average insured sums, indemnities and average rates per crop Crop Average premium rate Acreage hectares per contracts Premium total, UAH per contract Premium sum, UAH per hectare Insured sum per hectare Winter wheat 3.10%                       260 40,657 156 5,037 Winter barley 1.62%                       234 8,939 38 2,356 Winter rye 3.69%                       109 11,724 107 2,908 Winter triticale 0.99%                       190 6,739 35 3,600 Winter rapeseed 1.54%                       389 32,627 84 5,462 Wheat 1.65%                       315 25,713 82 4,939 Barley 5.25%                       240 38,174 159 3,038 Rye 3.75%                   9,854 1,155,223 117 3,122 Sugar beets 3.65%                       239 114,544 480 13,167 Sunflower 2.94%                       410 48,464 118 4,032 Rapeseed 14.20%                       127 82,938 653 4,599 Bea 1.29%                         32 905 28 2,192 Soya 4.63%                       363 72,750 200 4,328 Vegetables 1.60%                         11 8,193 745 46,550 Corn 3.90%                       362 100,728 278 7,133 Spring mustard 4.48%                       314 11,798 38 840 Tomatoes 3.80%                       663 696,633 1051 27,660 Chick pea 2.04%                         11 1,276 116 5,687 Buck wheat 1.00%                         88 24,471 279 27,952 Rice 3.00%                       352 197,640 561 18,716 Average 3.38%                       273 54,550 200 5,925 Data by region The oblast of Poltava was the leader by the number of contracts sold in spring-autumn 2011.  Three hundred eighty two contracts were signed in Poltava oblast. The insured acreage was 96,000 hectares. The total premium amounted to UAH 34 million or 32% of the total agri-insurance premiums in Ukraine. In these oblasts the producers of sugar beets, sunflowers and corn were most likely to insure. By number of contracts, the leaders are the oblasts of Khmel’nytsk (158 contracts), Vinnytsya (146 contracts), Odessa (103 contracts), and Zhytomyr (102 contracts). In all other oblasts the number of contracts per oblast never exceeded 100. In addition to Poltava oblast, the largest insured acreages were in the oblasts of Vinnytsya (46,800 hectares), Khmel’nytsk (37,200 hectares), Kherson (36,600 hectares) and Sumy (30,600 hectares). The highest premiums were collected in the oblasts of Khmel’nytsk (UAH 11.6 million), Vinnytsya (UAH 6.9 million), Kirovograd (UAH 4.5 million) and Zhytomyr (UAH 4.5 million). Table: agri-insurance by oblast Oblast Contracts Total acreage, hectares Sum insured, UAH Premiums, UAH Crimea Autonomous Republic 57 16,530 62,490,177 2,094,670 Vinnytsya 146 46,811 395,480,909 6,880,688 Volyn 32 6,314 35,441,029 950,265 Dniepropetrovsk 76 22,873 75,646,089 1,864,920 Donetsk 60 12,224 51,997,934 1,477,373 Zhytomyr 102 18,440 109,738,929 4,467,712 Zakarpattya 5 700 5,626,795 422,145 Zaporizhzhya 26 10,965 51,435,588 1,542,322 Ivano-Frankivsk 24 4,249 28,764,906 1,075,829 Kyiv 89 15,349 96,631,725 3,349,294 Kirovograd 84 29,083 144,442,608 4,500,355 Lugansk 64 13,535 41,212,761 1,155,739 Lviv 37 22,656 114,083,087 3,745,327 Mykolaiv 82 15,485 87,389,454 3,587,329 Odessa 103 19,773 139,691,985 2,558,958 Poltava 382 96,056 749,965,702 34,164,297 Rivne 34 14,497 101,459,633 2,033,981 Sumy 84 30,645 136,901,330 3,126,327 Ternopil 68 15,883 94,081,477 3,238,702 Kharkiv 73 20,608 105,712,615 3,942,607 Kherson 56 36,576 128,827,595 4,123,570 Khmel’nytsk 158 37,320 260,929,735 11,627,662 Cherkassy 54 14,957 89,768,606 2,459,782 Chernivtsi 12 1,759 6,174,076 251,604 Chernigiv 73 16,771 85,769,635 3,422,333 Total 1,981 540,057 3,199,664,378 108,063,789  The average premium rate throughout 2011 spring-autumn was 3.38%. At the same time, only in four oblasts the average rate per oblast was over 4%. Thus in Zhytomyr oblast the average rate was 4.07% (4.1% in Mykolaiv oblast, 4,56% in Poltava oblast and 4.46% in Khmal’nytsk oblast). The lowest rates were applied in the oblasts of Vinnytsya (1.74%), Odesa (1.83%) and Rivne (2%). The average contract insured 273 hectares. The average premium per acreage unit (hectare) was UAH 200. The lowest average premiums were paid in the oblasts of Dniepropetrovsk (UAH 82) and Lugansk (UAH 85). Agri-insurance was most costly in the oblasts of Poltava (UAH 356) and Khmel’nytsk (UAH 312). The table below illustrates the other major indicators. Table: Agri-insurance by oblast Oblast Average premium rate Acreage, hectares per contract Premium per contract, UAH Premium per acreage unit, UAH/hectare Crimea Autonomous Republic 3.35% 290 36749 127 Vinnytsya 1.74% 321 47128 147 Volyn 2.68% 197 29696 151 Dniepropetrovsk 2.47% 301 24538 82 Donetsk 2.84% 204 24623 121 Zhytomyr 4.07% 181 43801 242 Zakarpattya 7.50% 140 84429 603 Zaporizhzhya 3.00% 422 59320 141 Ivano-Frankivsk 3.74% 177 44826 253 Kyiv 3.47% 172 37633 218 Kirovograd 3.12% 346 53576 155 Lugansk 2.80% 211 18058 85 Lviv 3.28% 612 101225 165 Mykolaiv 4.10% 189 43748 232 Odessa 1.83% 192 24844 129 Poltava 4.56% 251 89435 356 Rivne 2.00% 426 59823 140 Sumy 2.28% 365 37218 102 Ternopil 3.44% 234 47628 204 Kharkiv 3.73% 282 54008 191 Kherson 3.20% 653 73635 113 Khmel’nytsk 4.46% 236 73593 312 Cherkassy 2.74% 277 45552 164 Chernivtsi 4.08% 147 20967 143 Chernigiv 3.99% 230 46881 204 Average 3.38% 273 54550 200 Data by insurers According to the data provided by the insurance companies, 13 companies insured crops and perennial plantings in spring-summer 2010. The companies UESK and HDI did not provide agri-insurance in this season. Based on the available data, the insurers can be divided into three groups by number of contracts sold.  It is an important indicator of market penetration, in particular at the regional level. As a risk management tool agri-insurance is more important for small and medium producers than for big producers and agro-holdings. Some insurers that signed few contracts yet collected considerable premium amounts are included in the second group. The first group consists of the leader companies: Providna, UASK, Brokbusiness and PZU –Ukraine. Each of these companies sold over 100 contracts during the season. The company Providna signed 868 contracts (44%) to insure crops on 177,000 hectares (33% of the total acreage insured in spring-autumn 2011). The company became the leader, to a large extent, due to the participation in the KhlibInvestBud grain purchase programme. The sales volumes and acreage insured by the Providna company were nearly twice as high as those of the two other leading companies (Brokbusiness and UASK). The UASK company rates next to Providna for all major indicators except the level of premiums collected. UASK sold 470 contracts (24% of the market) to insure 106,600 hectares (20%). At the same time, this company collected the highest amount of premium – UAH 45 million or 42% of the gross premium in the sector for the season. The company Brokbuisness signed 313 contracts (16%). The company is rated third for all other indicators. It collected UAH 15 million (14%) and insured crops on 75,000 hectares (14%). The company PZU-Ukraine is in the first group. This company did not participate in the KhlibInvestBud programme, however sold 114 contracts (6% of all contracts in this season).  The company insured over 38,000 hectares (7%). The first group does not include the companies ING0-Ukraine and UNICA. Both sold few contracts (43 and 16 respectively). At the same time, both companies collected significant premiums - UAH 2.9 million (ING)-Ukraine) and UAH 4.9 million (UNICA). INGO-Ukraine insured 55,000 hectares (10% of the total insured acreage). Yet we did not include this company into the leader group for the very low average portfolio rate (0.7%).  The Company UNICA is in the second group for few contracts sold. The second group consists of the following companies: INGO-Ukraine, TAS, Oranta, ASKA and UNICA. All these companies, except UNICA, sold over 30 contracts each. The company ASKA sold 53 contracts, more than any other company in this group. This company participated in the KhlibInvestBud grain purchase programme. The Company UNICA collected UAH 4.9 million, more than any other company in the group. This company seems to prefer to insure big producers and agricultural holdings. Similar tendencies were observed with regard to the winter crop insurance in autumn 2010. The Company INGO-Ukraine insured 55,000 hectares, more than any other company in this group. The third group consists of the companies that throughout 2011 spring –summer sold less than 20 contracts each: ASKO-DS, UPSK, Oranta-Sich and Universl’na.  Each of these companies insured no less than 10,000 hectares. It is important to notice that three companies in this group applied the average rate less than 1%. The company Universl’na is the only exception (7.08%), however the volume of sales of this company was very modest. Table: the insurers’ shares by a range of indicators Contracts, % Total sum insured for the group,% Premiums collected, % Acreage insured, % Premium rate per group Market leaders 89 74 74 73 4.05% Group II 10 23 24 25 1.54% Group III 1 2 2 2 0.48% In spring-autumn 2011, the average premium rate in this market was 3.38 %. This average rate was calculated by dividing the total premium collected by the sum insured. The mean value of the premium rate by company was 2.57%. Importantly, in the leader group the average rate for all (except one) companies was over 3%. PZU-Ukraine was the only exception with the average portfolio rate at 2.04%. The companies in the second group applied very different rates. For instance, the average rate for the ASKA was 3.55%, 2.99% for UNICA, 2.58% for Oranta and under 2% for the two other companies. In the third group all companies except Universl’na applied the average rate lower than 1%. These companies concentrated primarily on insuring collaterised crops or insured crops against one or very few specific risks. The major agri-insurance indicators by company are given in the table below. Table: Aggregated data by insurance provider for spring-autumn 2011 Company Contracts Sum insured, UAH Premiums, UAH Total acreage, hectares Average premium rate ASKA-DS 7               9,538,566                       83,026                   2,100 0.87% INGO-Ukraine 43            409,696,116                       2,853,931                55,277 0.70% UPSK 16                  65,786,531                           267,147                        8,507 0.41% TAS 41               86,421,252                     958,933                     14,711 1.11% Провидна 868                925,779,689                     34,205,405                   176,851 3.69% Providna 37                  38,876,620                       1,003,521                     14,742 2.58% Oranta-Sich 2                     2,353,680                                3,530                        1,791 0.15% PZU-Ukraine 114                  82,566,626                       1,686,214                     38,145 2.04% UASK 470                891,295,214                     45,174,815                   106,370 5.07% Universal’na 1 250,290 17,720                     103 7.08% ASKA 53                  53,659,849                       1,902,554                     12,069 3.55% Brokbusiness 313                471,092,650                     15,044,727                     74,755 3.19% UNICA 16                162,347,296                       4,862,266                     34,635 2.99% Total                1,981            3,199,664,378                   108,063,789                   540,057 We could not estimate the loss ratios for spring-autumn 2011 as the insurers were not be able to submit the relevant data before the end of the year. We are planning to collect the loss data and finalise this document in the first quarter of 2012. Agri-Insurance Development Project, IFC

13.07.2011

Insuring an Expanding, Evolving Beast

As worldwide demand for livestock increases, managing the associated risks becomes ever more crucial - disease alone is estimated to be responsible for a 20% production loss. But, many farmers are not fully protected. What’s holding things back and which options show the most promise? Big business, systemic risk Greater, more efficient and reliable agricultural production is needed to support the world’s increasing global population and per capita consumption levels (figure 1). It is estimated, for example, that world demand for animal protein will have increased 50% by 2020. This sector is however exposed to some hefty, systemic risks including climate change and disease; some estimates suggest that a staggering 20% of total livestock production is lost as a result of disease. With the power to negatively impact GDP, managing the major risks that threaten such a high value - livestock farming represents 40% to 50% of the entire agriculture farmgate value - and fundamental economic sector is essential. Yet, there are still many unresolved issues around loss compensation, including significant uninsurable causes of loss. Concentrating on disease risk, we discuss the current situation and options for the future. Pinning-down a moving exposure Catastrophic weather risks such as drought and flood are a major threat to livestock farming output, income and business continuity. These risks are evolving as the world’s climate changes. Livestock farming also faces considerable losses from highly contagious disease e.g. Foot & Mouth disease, highly pathogenic avian influenza and classical and African swine fever. The list of animal diseases notifiable to the OIE (World Organization for Animal Health) now totals more than 100. These diseases are also evolving; new or forgotten pathogens can emerge and re-emerge. Other new or forgotten livestock risks can also become apparent, such as the recent dioxin contamination in Germany. Exactly how diseases and pollution or contamination events spread is another important, ever-changing risk factor: globalization and the destruction of ecosystems (changing climate and human population expansion) act to increase the spread and rate of spread of animal pathogens. At the same time, significant progress has been made by international bodies such as the OIE to mitigate the spread of disease. From the perspective of animal disease and beyond the inherent challenges of fluctuating inventories and animals values, there are also many external factors impacting the associated exposures (values at risk) and these are also constantly on the move (see below, ‘Many genes influencing the exposure’). Clearly the means to recover quickly after a major event is important both for farmers and for the customers they serve. Alternative supply sources may not be readily available and/or affordable, and livestock production is a lengthy and costly process. Not surprisingly, the demand for protection against all major livestock risks is increasing, but it is by no means comprehensively available. Significant gaps in cover are the norm, even in developed insurance markets and insurance premium directly attributable to livestock insurance remains relatively small on the worldwide scale. From an insurance perspective this primarily reflects the potential scale of loss, limited loss experience, that the standard of loss is not well defined, that events are not independent and that the many and complex factors influencing the ultimate exposure complicate frequency/severity modeling. Many genes influencing the exposure The example of Foot & Mouth disease in the U.K. highlights the pace and extent of movement in this risk sector (table 1). While the number of confirmed cases reduced in the later outbreak, the number of animals culled increased more than eight-fold and the loss mushroomed. There were changes that occurred in the intervening years which in part help to explain why the disease came within reach of so many more animals in 2001 and caused a much higher loss: In the 1960’s Foot & Mouth was endemic throughout Europe and as a consequence there was greater awareness of the clinical picture. Livestock farming became more intensive over this time. Farm sizes and stock numbers increased dramatically and production cycles were in general significantly cut from 30 months or more to 18-22 months (the introduction of BSE2 controls accelerated this switch). Auction markets became more concentrated (800 in 1967, and 170 in 2001), as did slaughter houses (3,000 in 1967 vs. 520 in 2001). As a result, in 2001 animals were moved around more frequently and over greater distances between farms, dealers, auction markets, slaughter houses etc., with individual animals sometimes moved up to several times a day. Not surprisingly then, the 1967 primary outbreak was reported before the infected animals had left the farm, whereas the 2001 outbreak was not reported until the animals were already at a slaughterhouse. The trend in farming (to meet increased demand, streamline process and improve profitability) continues to be towards fewer, larger, higher value and less diversified farming units, alone signifying higher individual direct and consequential exposures. Animals continue to be transported more frequently and over greater distances. Variable local hygiene standards and authority responses, which may change over time, and the increasing sensitivity to human health considerations, (60% of current human diseases have an animal origin5) must also be taken into account, including trends in preventive slaughter: Such severe measures help to mitigate the spread of a disease but also increase individual exposures, destroying both diseased and suspected/possible diseased animals. Although some markets offer limited cover for losses relating to government slaughter, it remains controversial as to whether such exposures are insurable. Options today and tomorrow for a changed species According to the World Bank Survey 2008, only 38% of the surveyed countries offer farmers livestock epidemic disease insurance, mostly on a compulsory, semi-public basis and retained in the country (government compensation schemes or dedicated compensation funds pre-financed by farmers on a compulsory basis). The figure is closer to 70% for livestock accident and mortality cover. Where such programs exist, country-specific insurance products are generally on offer covering losses beyond the schemes (with sub-limited or full-amount business interruption insurance). This can happen because in such cases the exposure is better constrained. In addition, there is corresponding higher risk awareness, improved data, sufficient insurance penetration, reduced anti-selection and more adequate premium levels. Risk analysis and modeling difficulties are therefore narrowed, though not wholly overcome. Where they exist, these insurance policies have been successful and have grown in popularity over past decades. Premium subsidies and governmental reinsurance options have also helped to promote viable commercial insurance solutions, in particular in emerging markets. Where schemes seek to transfer risk into the private sector, livestock disease risk is often placed into the international insurance market due to its systemic nature, and to the handful of players with the necessary underwriting expertise. In consequence of the many aforementioned factors impacting the exposure, indemnity sub-limits, more exact definitions of covered exposures and additional exclusions are incorporated into the policy wordings. The market has a high reliance on reinsurance, which is not yet widely available because of the remaining difficulties involved in modeling epidemic disease emergence, spread and impact. International organizations, primarily the OIE, have to date made tremendous progress in standardizing the responses of its member countries to possible disease outbreaks. This has opened up the potential for private risk transfer. However, without public schemes to limit the exposure and bring the abovementioned improvements, the private sector cannot generally provide affordable disease cover to farmers. Although there are some alternative solutions available for livestock, there is only one livestock mortality index cover in the world (Mongolia - with high correlation between low temperature and livestock mortality). Canada, the U.S. and Spain have livestock index covers for pasture and rangeland livestock farming. However, none of these index products can be applied to livestock epidemic risk. Looking to tomorrow, progress will continue in the areas of disease detection and eradication, and the need to feed a growing population and protect farming income will add pressure to finding workable financial solutions against major risks. The involvement of governments enables the private sector to support livestock risks and will hopefully be adopted by more countries. Solutions are possible and steps forward have been made. A fundamental point, however, is that the complexity of this risk and extreme diversity of outbreak and spread scenario, necessitate that individual countries find their own appropriate public-private partnership, in which reinsurance can play an important role. 1 Publication “The State of Food and Agriculture 2009: Livestock in the Balance”, February 2010, http://www.fao.org/publications/sofa/en. 2 Bovine spongiform encephalopathy (BSE) 3 Department for Environment, Food and Rural Affairs (DEFRA), U.K. http://www.defra.gov.uk/foodfarm/farmanimal/diseases/atoz/fmd/2001/1967a.htm#spread 4 Department for Environment, Food and Rural Affairs (DEFRA), U.K. http://www.defra.gov.uk/foodfarm/farmanimal/diseases/atoz/fmd/2001/index.htm, and “Economic Costs of the Foot and Mouth Disease outbreak in the United Kingdom in 2001”. http://www.mho.hopto.org/btec/lessons/unit%201%20indexperience/assessment/fmd.pdf. 5 World Organisation for Animal Health (OIE). http://www.oie.int/fileadmin/Home/eng/Media_Center/docs/pdf/Key_Documents/final-brochure-en.pdf Rinat Bektleuov, Senior Underwriter Agriculture, PartnerRe

16.02.2011

Agricultural insurance system in Italy. Current status and perspectives.

Agricultural insurance system in Italy. Current status and perspectives. Giuseppe Pennucic, Antonella Pontrandolfi Agricultural activities face risks linked to market trends and environmental conditions, in particular climatic conditions and in Italy the heterogeneity of the territory determines a high variability of conditions and productions. In order to manage risks in agriculture, one the most important instruments used in the Italian agricultural sector is the insurance system, that without doubts can be one of the central climate change adaptation options. In facts, agricultural insurance allows to manage a wide range of risks and it is theoretically enough flexible to adapt itself to changed conditions and priorities. Agricultural activities face risks linked to market trends and environmental conditions, in particular climatic conditions and in Italy the heterogeneity of the territory determines a high variability of conditions and productions. These natural factors, associated with the scenarios of climate change, increase the level of uncertainty for agricultural activities, strongly influencing the interaction between climate and crops’ cycles (quantity and quality of productions) and between climate and farms’ investments (damages to equipments and infrastructures caused by extreme weather events). In order to manage risks in agriculture, one the most important instruments used in the Italian agricultural sector is the insurance system, that without doubts can be one of the central climate change adaptation options. In facts, agricultural insurance allows to manage a wide range of risks and it is theoretically enough flexible to adapt itself to changed conditions and priorities. Italian agricultural sector already defined the agricultural insurance system as a strategic choice, actively participating to the discussion at European level in order to introduce and enhance insurance systems. During the ‘70s, a National solidarity fund (NSF), managed by Ministry of Agriculture, has been created in order to organize and give contributions to farmers for compensation for damages provoked by adverse climatic events and natural disasters. In the meantime, the NSF offered contributions to premiums for monorisk insurance (hail), offered by private insurance companies. An important reform of the Fund has been passed in 2004, adapting and modernizing it in objectives and economic instruments. The main objective of the reformed system is promoting actions of prevention in order to face damages to agricultural and animal productions, to farm infrastructures and equipments, in the areas affected by natural disasters and extreme events. The main actions and instruments are: a) measures to support insurance contracts (contributions to premiums); b) measures to compensate farmers in case of damages to productions, infrastructures and plants not included in the National insurance plan. It is important to underline the principle of exclusion of compensation aid if the same damages are covered by contributions to premiums. The application of the reformed system in the period 2005-2009 has been positive, showing also further potentialities. The main indications are: - NSF has been ri-oriented, with a gradual substitution of ex post aids with contributions to insurance premiums (from 2008 covering almost the 80% of the financial availability); - constant increase of insurance spread among farms and a reduction of premiums paid by farmers (competition among private insurance companies); - reduction of monorisk (hail) versus increase of multi-risk insurances, with the great part of insurance contracts for adverse climatic events, covering risks both for productions and infrastructures (uncertainty due to extreme events occurred in the last years). - diversification of types of insurance, including also insurance contracts on crops’ yield; - new mind-set among farmers: premiums considered more and more a part of the farm costs (for instance, in 2009 no contributions have been given to premiums, but the insurance campaign has been positive). The instruments showed also some critical points, such as the inconsistence of the insurance contracts in the Centre and in the South of Italy (23% of total contracts amount), the importance to have a very high level of technical expertise to quantify damages provoked by events and a deep evaluation of the link between events and yield loss. A new and strategic phase started in 2009 with the CAP Health Check (Reg. CE/73/09). The articles 68-71 on specific support allow granting contributions to premiums to cover economic losses caused by adverse climatic events, animal diseases and plant diseases and pest infestations. Italy decided to accept the complexity of the new opportunity given by the CAP Health Check, integrating in a unified system the different funds, European funds on specific support, Common market organization for wine, that allows contributions to premiums for insurance on wine grapes, and National solidarity fund for agriculture. A big effort has been necessary to coordinate the creation of the new integrated system and of the proceedings, but several critical points have to be discussed and solved. Concluding, some considerations can be made about the future of the insurance as economic instrument for crisis management in agriculture and as tool of adaptation to climate change. First of all, insurance should be considered an instrument among a set of actions operating at several levels of risks and damages. Regarding climate change and considering the uncertainty of the scenarios, the best choice could be to build up a very flexible set of tools and actions. From this point of view, there are some issues that still need to be analyzed in order to improve the tool and help farmers in case of extreme events and change of environmental conditions: - definition of general homogenous criteria for risk assessment and damage evaluation referring to equity and competition rules, respecting the private nature of the insurance contracts; - specific analysis of climatic risk and evaluation of damages caused by climatic events in the insurance system and contracts; - effectiveness of insurance system: does the current systems need an adaptation in order to help farmers but in the meantime to enhance a farms’ structural adaptation to climate change? - performance of the policies to assess their effectiveness and the improvements necessary; - discussion at European level about policies and their application (new common rules and new instruments?).

12.01.2011

Pros and cons of surface-based and space-based meteorological observations

While satellite data provide significant advantages over conventional surface-based observations, there are also important limitations in how the data can be used to infer information about the state of the atmosphere. Specifically, information about the atmosphere is obtained indirectly by measuring the properties of electromagnetic radiation arriving at a space-borne sensor. That is, weather variables, such as precipitation or surface temperature, need to be inferred from quantities that provide a proxy for the weather variables of interest. For instance, the amount of precipitation can be inferred from the amount of energy (radiation) that is emitted when water vapor condensates in the atmosphere and errors are therefore inherent to any satellite-based estimate of precipitation1. Another important source of error is the contribution of the underlying land surface (e.g., vegetation) to the electromagnetic signal measured by a satellite-based instrument. Some of the important advantages of satellite data include:  The high vantage point provides a broad field-of-view and permits the observation of large-scale weather phenomena in one single view.  Satellite data provide measurements of atmospheric observations in areas of the globe that are less equipped with surface-based stations.  The continuous observation permits the monitoring of and warning for short-lived phenomena such as tropical cyclones or snow storms.  Advanced communication systems are an integral part of satellite systems and provide quasi real-time access to weather data. In situ measurements at weather stations, on the other hand, can be directly interpreted, but are more prone to be influenced by local factors and may therefore not be representative for larger areas. Also, the density and distribution of surface-based observations is inhomogeneous across the globe and particularly sparse in less developed (and less populated) areas and over ocean surfaces. It is important to note that direct measurements from surface stations are indispensable to: (i) provide accurate and precise measurements of meteorological variables that cannot easily be derived from remote sensing (ii) monitor small-scale phenomena (iii) provide independent validation and calibration data for satellite estimates Satellite observations, on the other hand, are critical to the generation of warnings and forecasts of hazardous conditions such as storms, tropical cyclones or high winds and are more difficult to be derived from station data. (Satellite-derived temperature data is used to measure the duration of cold cloud tops over a region for the determination of accumulated rainfall (3mm of precipitation for each hour that cloud top temperatures are measured to be less than 235 K, see Arkin, P. and Meisner, B. “The Relationship between Large-Scale Convective Rainfall and Cold Cloud over the Western Hemisphere during 1982-84,” American Meteorological Society Monthly Weather Review Vol. 115, Issue 1. Pp/ 51-74 (1987).) More than 90 percent of the volume of data assimilated in global numerical weather prediction models today comes from space-based systems. Thus, the strengths and weaknesses from surface and space-based meteorological observations are complementary and satellite-based systems are not a substitute for observations collected on the ground. Surface-Based stations: - Direct weather observation (accurate/precise) - Narrow measuring footprint - Long-term climate records - Local sampling Space-Based observations: - Indirect weather observation (proxy) - Synoptic broad field of view - Short records (< 10-15 years) - Continuous global coverage Source - World Bank

01.11.2010

Agricultural insurance in Europe

This information is extracted from the IPSC – Agrifish unit of the Joint Research Centre (JRC) of the EC, Agricultural Insurance Schemes. November 2006 For text with tables please download file >>> 1. Introduction There is considerable diversity in the range of agricultural insurance schemes available in Member States throughout Europe. Some of these are subsidised by Member States and others purely privately funded. Insurance is probably the best known tool for risk management but the nature of agriculture presents a number of issues. For example, systemic risks (i.e. a lot of people suffer losses at the same time) make it necessary for insurance companies to charge very high premiums if state contributions are not available. These premiums are often unaffordable for many farmers. Because of this, comprehensive agricultural insurance schemes therefore need strong support from the public sector. Drawing on the Agricultural Insurance Schemes report by the IPSC – Agrifish unit of the Joint Research Centre (JRC) of the EC this paper highlights the subsidised and non-subsidised insurance schemes throughout the EU. 2. Crisis and Disaster – Regulation for State Aid The “Community guidelines for state aid in the agriculture sector” (EC, 2000) allows for adverse weather conditions on agricultural production to be assimilated to natural disaster if the damage is more than 20% of normal production in the less-favoured areas and 30% in other areas. Insurance premiums may be subsidised up to 80% when insurance covers natural disasters, or assimilated events. If the insurance covers other losses, the maximum aid is 50% of the premium. 3. Types of Crop Insurance Hail insurance is the main type of insurance extending to crops in the EU. There are some other insurance policies extending to other meteorological events e.g. frost. These are known as combined risk insurance. Yield insurance is a term applied to a type of policy that covers losses for a given crop due to any meteorological event. Whole-farm yield insurance refers to all crops produced by the farm. Another type of insurance, Revenue Insurance, combines yield and price insurance. This provides the farmer with payment if his production falls below a threshold. All these types of insurance are based on the results of individual farms, and losses are adjusted measured on the field. Insurance can also be based on: • An index common for an area (index insurances) • The statistical yield for the year in a predefined area (Area-yield insurance) • Area yield/revenue below a certain threshold in a particular area for a particular crop all the farmers are compensated (Area-revenue insurance) • Meteorological indicator or satellite image (Indirect-index insurance) 4. Livestock Insurances There is different treatment for losses in the livestock sector. For example, farmers who lose livestock due to a ‘List disease’ are generally supported by MS governments and EU institutions e.g. they receive the value of any destroyed animals. A number of Member States finance these direct losses from the national budget (Denmark, Finland, France, Ireland, Italy, Luxembourg, Portugal, Spain, Sweden, and UK). Other countries have a co-financing system – a Public-Private financing scheme – in which farmers pay a tax to a compulsory fund structure (Austria, Belgium, Germany, Greece, The Netherlands). Consequential losses e.g. resulting form movement standstills are most often completely borne by the farmer themselves although some other countries will partly compensate for these indirect losses by paying above the market value of those animals forcibly slaughtered (Austria, Belgium Ireland). In the absence of public assistance for livestock insurance private insurance schemes have arisen for some livestock production (Germany, Netherlands, Sweden, Spain, UK, and Italy). 5. Agriculture Insurance in Europe Table 1 shows the range of agriculture insurance products available in different European countries and the amount of the premium subsidised by government. In Spain all the insurance companies operate in a pool known as a co-insurance regime. The system is run in collaboration with the Government and the farm unions. Countries such as Austria, France, Italy and Luxembourg also have well-developed insurance systems and most risks are covered depending on the insurance scheme. Single and combined risk schemes are available in 9 of the countries listed but only hail and a few other risks are covered. Hail insurance or single-products insurance are the main products available in the UK, Belgium and the Netherlands and demand for other farm insurance products is negligible. There is no public support to insurance in these countries. 6. Premium Rates A comparison of premium rates, expressed as a percentage of the insured value indicates that these vary considerably, for example from a low level of about 1% in the UK and Germany to about 6-8% in Spain, Portugal, and Italy. However, there are a number of determinants of the level of premium rates in crop insurance that make comparing these rates in a meaningful way very difficult. These include: • The frequency of risks in time and on area • The type of risk (hail, drought) and the number of risks covered • The sensitiveness of crops • The number of farms insured • Technicalities like deductibles Table 1 shows the percentage of premiums subsidised by countries. This will tend to vary depending on the country’s policy to promote some particular type of coverage, to help some agricultural sub-sector or to facilitate some types of farms. The annual subsidies to the EU25 are around 497M? (32% of premiums). 7. Ad Hoc and Fund Payments It should be noted that other risk management tools exist in most countries. These include ad hoc payments and compensation payments. Table 2 shows the level of and reason for payment from these sources fro a number of countries. It is important to note that where damage could have been insured compensation from these sources is forbidden by law. This has the effect of fostering agricultural insurance in these countries. Compared to the annual subsidies paid out by the EU 25 (497M?) the average amount paid out in ad hoc payments is 904M?. About 50% of the ad hoc payments are given for natural disasters like drought, frost, flood and excessive rain. These risks are insurable in countries providing yield insurance. 8. Conclusion Agricultural insurance is a complex issue. The existence and take up of such schemes depends on a range of variables which makes direct comparison in different countries difficult. The subsidising of insurance schemes raises the possibility of an EU-wide system of agricultural insurance. Theoretically these could be funded through pillar II of the CAP, possibly by modulation. Again, however this is an inherently complex issue with a range of issues to be addressed including compatibility with WTO agreements, the requirement for a large percentage of farmers to take up the scheme, cost, political will, technical feasibility/database information availability, and the view that because of necessary loss adjustment subsidising agriculture means subsidising the insurance industry. In relation to this last point where insurance products offer a wide range of coverage (i.e. for systemic risks) there is a direct link between development of these and public support. In other words there is likely to be greater support for subsidising single risk schemes (e.g. hail) than those schemes covering a range of risks. Dr Kevin Pelan

19.07.2010

SystemAgro: sustainable crop insurance in response to climate change

SystemAgro: sustainable crop insurance in response to climate changeHolger Schwarz, Special and Financial Risks, Munich ReLong-term crop insurance is operated across more than 200 million hectares of agricultural land around the world. For more than 35 years, valuable experience has been gathered on this crop insurance system. Munich Re has filtered out the characteristics of the system which are responsible for its long-term success and defined them as a 'best practice' for crop insurance. Worldwide experience in crop insurance Long-term crop insurance is operated across more than 200 million hectares of agricultural land around the world. For more than 35 years, valuable experience has been gathered on this crop insurance system. Munich Re has filtered out the characteristics of the system which are responsible for its long-term success and defined them as a 'best practice' for crop insurance. SystemAgro: The framework is provided by a public private partnership designed on insurance principles. All insurance-related conditions which are important for securing the growing of agricultural crops are governed by laws and regulations. These are, for example: access to insurance, covering the insurance requirement at reasonable premiums or transparency of insurance conditions and claims handling. Climate change as a real challenge Our world is facing a number of serious problems: financial crisis, climate change and security of food and energy supplies are among the most important. Agriculture is particularly hard hit by these problems, as it has always been - and will be even more so in the future - at the centre of the tense triangle formed by the climate, the financial markets and security of food and energy supplies. The low global stocks of agricultural raw materials, especially grain (at the end of 2008, international grain stocks were only enough for 2 months), mean that agricultural production needs to make a huge contribution to improving the situation in the global energy and nutrition sector. The increase in the world's population by around 3 billion people by 2050 will increase demand for agricultural raw materials and will also force a change in eating habits. The problem is exacerbated further by the trend towards reducing usable agricultural space and the increased use of agricultural materials for energy generation. The fact that it has become more difficult to obtain credit as a result of the financial crash is hitting agriculture with its long financial cycles (from sowing through to harvesting) particularly hard.Even when the financial crisis is over in 3 to 4 years' time, global fears about food security because of price instability and the delicate balance between supply and demand are set to remain in place. Government and private investment into agriculture which is secure in the long term therefore needs to be reinforced. All the more so as agricultural production is directly subjected to climatic conditions, and especially to the rigours of adverse weather conditions. In the past, Europe's farms have been blessed with two important resources: fertile soil and sufficient water. But supplies of both are getting shorter. For example, the 2003 drought damaged German agriculture to the tune of around 1.3 billion Euros. The farms affected had to bear the brunt of the damages themselves, as the government's ad-hoc payments were very low: according to the German Farmers Association, they amounted to 72 million euros, less than 6 % of the actual damage. Crop insurance based on public private partnership does not yet exist in Germany. The "natural" compensation of increased prices in the event of a bad harvest (supply and demand) reduced the extent of the damage for many farmers in 2003, as the prices of agricultural produce increased. However, since the development of prices in 2008 at the latest, it has been known that a poor harvest can no longer necessarily be compensated for by higher product pricesfor what are scarcer quantities of agricultural production. After all, it is increasingly factors which bear no relation to regional crop volumes which are influencing increased price volatility. The situation in Poland in 2006 was similar to that in Germany in 2003. The extreme drought in the spring and summer caused damage to the farming industry of around 600 - 700 million Euros. The ad-hoc compensation payments provided by the Polish government represented just a fraction of the actual financial losses. As a result, the Polish government pressed ahead with securing against natural risks in the form of crop insurance worked out in conjunction with farming associations, the insurance industry and universities. This is based on a law to promote agricultural insurance which was passed in 2006. The law proposes subsidising crop insurance premiums by up to 50 % and other fundamental regulations for government involvement in crop insurance in the form of a public private partnership. As a result of increasing specialisation in production, the influence of natural risks on production results in agricultural cultures has increased still further. The changing climate has reinforced the influence even more. There are numerous scientific studies which have provided evidence that the changing climate around the world is already having an impact in the form of increased and increasingly intense extremes of weather. This applies to heavy precipitation, periods of heat and drought and storms, among other things. For other extremes of weather and the damage caused by them, global quantification of the influence of climate change is more difficult, although it is already possible in some areas. There is evidence that events which are associated with major thunderstorms - such as hail and cloudbursts - are on the up. These increases have been observed, for example, in the USA to the east of the Rocky Mountains, in the south of Germany and in Switzerland. The year 2009 seems to underline this trend. In Germany, the hail insurance companies based in Bavaria have been faced with high levels of claims the likes of which they last experienced in 1993. Enormous hail damage has been recorded in Switzerland. What is striking in both countries is that a few powerful hailstorms have made up a significant proportion of the overall loss burden. In the state of Iowa in the USA, a single hailstorm in 2009 caused over 50 million US dollars of damage to agricultural crops. Current measurements prove that climate change is happening and has accelerated over recent years. - Over the last 100 years, the global temperature has increased by 0.7 °C, and as much as 1.1 °C in Germany and even 1.5 °C in the Alps region. - The surface temperatures of the sea in the areas in which tropical storms are generated have increased by 0.5 °C since the early 1970s as a result of climate change. It becomes clear that global warming since the beginning of the age of industrialisation (1750) has largely been caused by the anthropogenic emission of greenhouse gases and only to a lesser extent by natural factors (intensity of the sun). The increasing influence of climate change on extremes of weather and the resulting damage caused can also be seen in agricultural production and insurance in the increasing exposure to late spring frosts. For example, a project on climate change in the fruit-farming sector in Germany revealed that the risk of late spring frosts had significantly increased for a number of varieties of fruit. This is down to the fact that blossoming is beginning earlier thanks to shorter and milder winters. As the frost period and especially the date of the last spring frost has not got earlier in the same way, the risk of frost damage has increased. In the major fruit-growing areas of Germany, they are reckoning on a sixfold increase in the late frost risk for cherries and a twofold increase for apples. Frost while the trees are in blossom is among the most dangerous weather events in the fruit-farming industry, as in extreme cases it can destroy the entire crop of one year. Further analysis is required in order to determine the influence of climate change on the trends in terms of damage from natural disasters. For agricultural production and insurance, the investigations will focus on: - Regional differentiation of changes in claims- Changes in claim distribution- Investigation of potential new claim scenarios The increasing intensification - as a result of technology and specialisation - and the resulting increase in demand for investment and outside capital in agricultural production mean that the safety net for the farmer already needs to be made tighter. Agricultural insurance - which is one of the best informed sectors of the insurance industry when it comes to exposure to natural hazards - can play an active role because it is not at the very beginning of the learning curve. Higher risk premiums as a result of the costs of disaster claims which have increased and can be expected to increase further can only be handled with a professional approach by all parties affected by the risk. This can be called a "Public Private Climate Partnership" in the broader sense. The essential aim of SystemAgro is to give the farmer access to an intelligent management instrument in order to strengthen his business on his own initiative and his own responsibility. The 4 pillars of SystemAgro The 4 pillars, also known as the BLOC, all carry equal weight. If one pillar fails, this jeopardises the stability of the system as a whole. The pillars therefore need to be anchored by government regulations in the shape of laws and ordinances. However, the concrete arrangement of the columns is flexible. SystemAgro only works as an agricultural policy control instrument if the existing structure of the agricultural and insurance industry is taken into consideration. B - Backing: Subsidies for insurance premiums B ... is the foundation for taking out insurance policies and has already been introduced in most markets. By subsidising the premiums, the government lays the foundations for buying an insurance policy. Without premium subsidies, the insurance premiums for comprehensive crop insurance are virtually prohibitive and/or the deductibles demanded of the farmers are so high that compensation payments are only very rarely made. This is because of the short return periods of agricultural loss events as compared to, for example, those in fire insurance. The geographical extent of the damage caused by, for example, a drought, is also greater than in other sectors of industry. As a result, the premiums are very high. Italy 2009: Collapse of the crop insurance market. The premiums for crop insurance for specialist crops such as vines, fruit or vegetables are up to 20 % of the sums insured in Italy. Farmers can only afford adequate insurance with deductibles of 10-30 % of the sum insured with government subsidies of up to 80 % of the premium. As the Italian government had not yet reached a decision on the level of premium subsidies by the beginning of the 2009 risk period, farmers this year insured considerably less areas and crops against natural hazards (especially frost). Instead of subsidising premiums by up to 80 % as in 2008, the current discussions are focusing on a figure of around 40-60 %. Current estimates suggest a downturn in the market premium by about 20 %, which corresponds to about 50 million euros. This example shows that farmers only take out crop insurance when the government provides substantial premium subsidies. Premium subsidies which are approved in the long term are a vital prerequisite for the stability and sustainability of a crop insurance system. These should be a reliable and permanent element of the government budget, as in the USA, and consolidated in an agricultural insurance act. This is the basis for economic calculations both for the insurers and for the farmers. This also means the government can budget its expenditure on crop insurance in the long term. A government acts wisely by pursuing an integrated agricultural policy and linking premium subsidies to other tools. In the USA, for example, taking out crop insurance is a prerequisite for taking part in other government-sponsored programmes in the risk management sector. L – Loss Sharing: Financial state support for insured catastrophe losses L ... Government involvement in insured disaster claims stabilises the system over time and makes private risk capital available. As a rule, the government has a public disaster aid fund which can be used on an ad hoc basis. This comes into play most often for large-scale damage caused by drought, floods and frost. High levels of insurance take-up can only be achieved if crop insurance is the method of choice - with no competing disaster aid. In systems which are still in the development phase, it is a real challenge for the government to integrate existing ad hoc aid into SystemAgro. The benefit of crop insurance over ad hoc aid is that the farmer has a legal entitlement to compensation payments in the event of a disaster and the government can use the infrastructure and the risk capital of the insurance industry. This means distribution is not just on the "watering can principle", instead, the individual damage sustained by the farmer can be calculated and the compensation paid when the farmer needs it most. The example of the major flood of 1993 in the Midwest shows how loss sharing between the insurance industry and the government stems insured disaster damages and is crucial for the stability and sustainability of a crop insurance system. In summer 1993, following extreme levels of precipitation, the Missouri and the Mississippi and their tributaries broke their banks and caused enormous damage to agricultural crops. In Minnesota alone, the damage amounted to 360 million US dollars which the insurance companies had to pay out to the farmers. Without government involvement in these compensation payments, the crop insurers in Minnesota would have had to pay out six times the revenues they had received in 1993. This extreme year alone would have taken the loss cost over a period of 20 years to 20 % above its actual level. The farmers would therefore have faced extraordinarily high increases in premiums. If the premiums had not been increased, access to private risk capital would have dried up. All this as the result of a single loss event. As a result of sharing the loss between the government and the insurance companies, crop insurance can continue to be available, even after years of extremely high loss ratios. This means that, if the level of cover is high, crop insurance remains a very consistent and therefore plannable cost factor. In this respect, what were the consequences of the major drought in South America in 2008/2009? The extremely long, intensive dry period caused damage of around 3.8 billion euros to agricultural crops in Argentina alone. As in the neighbouring countries of Uruguay and Paraguay, which were also affected, the crop insurance companies in Argentina were forced to pay out more than five times as much in compensation as they had received from the farmers in premiums. It was only because of the poor market penetration of crop insurance and its relatively low standing in the insurers' portfolios that there was no major crisis in the entire crop and hail insurance market. As the demand for crop insurance is set to increase in Argentina, this development needs to go hand in hand with risk sharing between the government and the insurance industry because of the high potential for damages as a result of drought. O – Open: Access for all farmers O ... all the framework conditions include all agricultural operations. All farmers are beneficiaries of the financial support of the government. This is achieved by designing an open crop insurance system. This means that all farmers wishing to take out insurance must be registered with the system. This means that SystemAgro can contribute to substantial market penetration and makes it an efficient agricultural policy control instrument. In the USA, market penetration has reached more than 80 % of land area. This shows that by specifically controlling transfer payments into the crop insurance system, the government can achieve high levels of acceptance among farmers. All natural hazards which could significantly reduce the yield of American farmers are bundled onto a multi-risk package to guarantee comprehensive insurance for the individual farmer. Besides premium subsidies and government involvement in disaster payments, the stability and sustainability of the insurance systems can be ensured by balancing out different insured perils on a regional basis. With the so-called MPCI (multiperil crop insurance), fruit farmers in California facing high risks of frost, wheat farmers in Kansas facing high risks of drought and corn farmers in the Midwest facing high risks of hail can all be insured. Insurance premiums are still affordable for US-American farmers and the average coverage level is high at 70 - 75 % of the historical average yield. C – Central and uniform: Central structure and uniform insurance conditions C ... The central structure is a prerequisite for the transparency and efficiency of a crop insurance system. On many occasions in the past, approaches to crop insurance systems have been implemented and supported with premium subsidies, only to be discontinued just a few years later because of insufficient premium rates and high loss ratios. These attempts not only failed in the objective of setting up a sustainable risk management system, but also swallowed government funds with no benefit in the medium term. Experience shows that risk-commensurate premiums are enormously important given the frequency and wide scale of yield losses and that competition on premiums severely jeopardises the chances of survival of a newly launched crop insurance scheme. Uniform insurance conditions including premiums, deductibles and guidelines for sales and loss adjustment are indispensable for the development of sustainable crop insurance systems for two reasons: 1. Only risk-commensurate premiums allow risk carriers to shoulder losses incurred. Otherwise the system collapses. 2. The government has a legitimate interest in the funds it provides (premium subsidies, loss sharing, development and administration expenses) being put to the long-term use of the farmer and/or the agricultural industry. The main priority is on transparency and efficiency when it comes to the use of government funds. In order to implement uniform conditions for all those involved, monitor these and adapt them as the system evolves, a crop insurance system based on SystemAgro needs to have a central structure. Its most important functions are: 1. Implementation legal regulations2. Implementation and continuous adjustment of uniform conditions for the operation of SystemAgro3. Licensing of the insurers involved4. Monitoring of the use of government resources (premium subsidies, loss sharing)5. Increased efficiency This central structure can be adapted to suit the regional circumstances. In the USA, for example, the RMA, a division of the Agriculture Ministry, guarantees uniform guidelines with respect to premiums, products, insurance conditions and loss adjustment. Among other things, it has defined premium rates for each crop, region and product which are binding for all insurance companies. The insurance companies are regularly audited on all the processes. As soon as adjustments to the crop insurance system are required, these are issued by the RMA on a central basis. At the same time, all crop insurance companies must fulfil minimum standards set out by the RMA. These include, for example, guidelines relating to minimum risk capital levels or risk transfer. Only insurers who meet these standards are granted a sales licence and are authorised to offer subsidised premium rates. If a crop insurance system is operated by means of a pool, this takes on the role of the central structure. In Spain, insurance companies pool their policies in the Agroseguro insurance pool. Agroseguro collects the premiums for the participating companies and, in conjunction with ENESA, a subdivision of the Agriculture Ministry, controls all important insurance processes. These include product development, definition of insurance conditions and sums insured for the different crops as well as loss adjustment. The Turkish equivalent, the insurance pool Tarsim, has also centralised the principles of loss adjustment alongside all other important processes. The use of external loss adjusters is controlled by the pool. Even before Tarsim was set up, claims handling was controlled by a central company for all companies in the market. When Tarsim was founded, this company was integrated into the pool. In the USA, Spain and Turkey, the creation of a central insurance unit for farmers, the government and the insurance industry has resulted in a uniformly transparent structure which works cost-effectively and powerfully in the interest of all parties involved. Uniform conditions and a central structure cannot replace the insurance industry, which takes on the role of risk carrier, fulfils the important functions of sales, processing and customer service and works with the central structure to initiate product and process improvements. It is all about the right cover Only if farmers are offered a tool for individual risk management can the crop insurance system be sustainable and lead to a high level of insurance take-up. There are essentially two different cover systems: 1. Individual yield cover2. Regional index insurance based on one or more weather parameters The different ways in which the two cover systems work can be demonstrated based on cover levels, price modelling and loss calculation. Index insurance is priced according to a meteorological yield model. If this is simply designed, it means that a few simple weather parameters such as precipitation and temperature are simply correlated with a loss potential, which means there is a high risk of the farmer suffering losses without the index insurance kicking in. Arable production can only be approximately understood and predicted based on complex models. A huge volume of extremely accurate input data is required, which makes this an expensive option in practice. To date, models which are sufficiently accurate have only been produced on a very small scale and require large amounts of measurement. Therefore there are strict limits on individual cover for farmers at risk-commensurate premium rates based on index insurance. At the same time, experience in designing and pricing index insurance cannot easily be transferred between different regions and crops. India, May 2009: Cyclone Aila devastated fields across large swathes of Eastern India. Damage sustained by the farms affected was considerable. Those who had taken out index insurance were hoping for compensation payments. However, the cyclone did not meet the defined precipitation thresholds which would have led to a compensation payment. As that index product was only based on a volume of precipitation, the majority of the damage - caused by the storm and the flooding - was not covered. This example shows that index insurance based on simple models is not suitable for predicting complex effect mechanisms because of the low level of correlation with the individual damage sustained by the farmer. For this reason and because of the fact that of a total of 75 million euros in damage to agriculture only 10,000 euros was compensated for through index insurance, the Indian government is now considering introducing a system based on individual yield cover. Only individual yield cover offers the farmer what he expects. Reliable, sufficient compensation in the event of a claim. This leads to high levels of acceptance. In addition to regional risk information, the farmer's historical yield record is used as the basis for pricing and product design. The level of data collection required is reasonable. If the farmer achieved a low average yield over the previous years, he will be insured based on the low statistical yield expectation. However, if the farmer's yield has been good in recent years, the level of yield for the year insured is also expected to be high. Index insurance based on a simple model may offer the advantage of quicker loss calculation because the data available can be quickly evaluated with respect to whether a defined threshold value has been reached. However, the benefit of index insurance relative to loss adjustment is outweighed by the disadvantage that the the cost of procurement, quality assurance and evaluation of the data for a sufficiently realistic model is too high. In the future, crop insurance will be able to use state-of-the-art technology in order to keep the work involved in determining the yield and thus adjusting the loss on the one hand, and to make sure the system is objective and not open to manipulation on the other. During this process, locally obtained yield data are used to calibrate remote sensing data. These remote sensing data are based on geo-coordinates and can project local differences in yield onto geographical spaces. SystemAgro - the success factors at a glance Overall, what sets SystemAgro apart is five success factors: Stable: SystemAgro is provably sustainable for the entire agricultural industry. SystemAgro also creates added value for upstream and downstream businesses. Tailor-made: SystemAgro is a flexible agricultural policy instrument which is tailored to the individual risk management of the farmer and can be integrated into the individual agricultural policy of any country. SystemAgro also takes into consideration the existing structure of the insurance industry. All farmers: SystemAgro allows all farmers to insure themselves - irrespective of the exposure of their farm or the crops they produce. Rated: SystemAgro ensures the farmer's solvency. This means he can not only spend money on the inputs he needs, but also has the financial resources for the business investments for the future, such as new agricultural machinery or buildings and equipment. The farmer's stable income improves his credit rating, making it easier for him to borrow money from the banks. Transparent: SystemAgro is organised on a central basis. This gives both the government and the farmer an insight into the use of the subsidies and into the system for calculating premiums. The success of SystemAgro's integrated approach lies in the fact that all those involved in the public private partnership can derive real benefit from the system: - The farmer gets a professional management tool to secure his individual risk situation. -The insurance company makes a commitment in the long term with a view to achieving profitable results over time. -The government gets a stable agricultural industry and at the same time gets help in overcoming the challenges posed by climate change through a public private climate partnership. SystemAgro is a win-win-win situation.

04.06.2010

Crop insurance schemes depend on two things

Crop insurance schemes depend on two thingsRené Gommes and Jürgen Grieser Crop insurance schemes depend on two things: a relatively complex set of mathematical tools and reliable data on many different variables, ranging from weather to agricultural output. Insurance companies can protect farmers from harm, but they need reliable statistics which, all too often, are unavailable in developing countries. When a weather hazard hits a country, not all sectors of agriculture are affected in the same way. The vulnerability of crops differs from variety to variety. Some places are more vulnerable than others. Moreover, the growth stage matters too. Young crops are less vulnerable than mature crops, for instance. The impact of a storm thus depends not only on its force but also on the season and the varieties cultivated in the disaster area. To assess risks adequately, insurers need data on the specific vulnerability of their clients’ crops as well as on the likeliness and strength of hazards. If insurance companies have reliable data and get the mathematic modelling right, they can spread risks over time and distribute them over many people. By collecting premiums and disbursing compensations, they can reduce the costs hazards inflict on clients and, at the same time, make a profit themselves. Obviously, the business model is quite challenging. Today, crop insurance schemes are well established in rich nations, but not so in developing countries. The estimated worldwide turnover of agricultural insurance (covering crops, livestock and forestry) amounted to ­$ 6.5 billion in 2001. North America and Europe ­accounted for 84 %, Africa accounted for only two per cent and Asia and Latin America for four per cent each. There are several reasons for crop insurance being less common in developing countries. The most important are: – Many farmers practice subsistence farming and generate only very little marketable surplus. Therefore, they are hardly integrated into the monetised economy. Insurance companies, however, are financial service providers, so they are geared to the monetised economy. Subsistence farms, moreover, tend to rely on many different varieties of plants and animals. That in itself reduces their exposure to risks, but it also makes it next to impossible to accurately assess their risks in financial terms. To reach the people, insurance companies need innovative approaches (“microinsurance”). – Hazards that affect crops tend to cover large areas, affecting many farmers at once. Droughts are the most common hazard. They impact entire regions, not only individual farms. Therefore, the damage they cause is large-scale even though the individual farms concerned may be quite small. Generally speaking, risks tend to be lower in regions of moderate climate. Food crops, moreover, are generally considered “low value crops”, so they are less appealing to insurance companies than cash crops like cotton or tobacco.Growing relevance In spite of such challenges, agricultural insurance is becoming ever more important in developing countries. This trend is driven by several factors, including the following:– The world’s population is growing, and so is the need for food. All available means must be used to protect people from food insecurity, and insurance certainly is an option. – Farmers all over the developing world are gradually adopting more commercial forms of agriculture. ­Accordingly, their dependence on international markets and market prices is growing, and so is the scope for insurance coverage. – Climate change implies that there will be more weather hazards. Agriculture will obviously be ­affected. – As foreign investors increasingly move into agriculture, their demand for insurance is growing too. – Governments consider insurance a healthy way to support their countries’ agriculture.There are several kinds of crop insurances (see box). Each has specific advantages and disadvantages. All insurance companies, however, tend to impose risk-reducing practices, such as the choice of planting dates or specific varieties that are resistant to disease or drought. Moreover, insurance companies depend on reliable data on weather, yields and related matters. The data must span enough time to be statistically relevant, but also be recent enough to relate to events that are likely to occur in the ongoing crop season. Typically, insurance companies need data from the past 15 years. Data bottlenecksFor several reasons, meteorological networks are not up to the job in many developing countries. Typically, national meteorological and hydrological services (NMHS) have adopted a commercial approach, so they don’t run weather stations in “remote” areas. These ­areas seem less important because of limited user ­requests and, accordingly, they generate lower revenue. Where the main customer of an NMHS is the aviation industry, the most reliable stations are located near airports, so there is relatively good data for major cities and their surroundings, but not for rural areas. Many countries, moreover, treat their meteorological data as confidential. In practice, urgently needed information on agricultural regions is often not available. Depressingly, meteorological networks have eroded in many countries since the colonial era. The main reason was that the economies were too weak to sustain this kind of public infrastructure. For many regions, the statistics of the 1960s are better than those of the past two decades. In other places, data have been lost for good. Climate change, however, means that recent data are becoming ever more important because it is impossible to extrapolate from long-ago experience.To some extent, indirect methods can substitute for direct meteorological observation. There has been good progress recently in computer simulation. Stochastic weather generators (SWGs) are programmes that deliver a large number of data. Satellite-based technology can also be of help. To be reliable, however, such information always needs to be calibrated against empirical ground data. Mathematical modellingTo design insurance schemes, providers typically use the mathematical tool of “yield functions”. These functions are derived from existing data. They provide models of how different kinds of weather impact farm yields. This is another area in which ample data are needed. So far, the insurance industry has not been able to calculate yield functions for all kinds of environments, crops and hazards. As is true of stochastic weather generators, it is always important to calibrate yield functions against empirical statistics. Generally speaking, yield data are more readily available than meteorological data. Most countries publish yield and production figures. A drawback, however, is that only few developing countries have reliable statistics at the regional and local levels. Governments use sampling schemes that are designed to provide reliable figures at the national level. Therefore, it is very difficult to do crop modelling at the level of a specific village or district. Doing so, however, would be useful to insurers.Mild and extreme hazardsMild hazards can mostly be modelled with standard tools because their impact is quite predictable. A mild drought, for instance, means that plants do not grow as big as they otherwise would, and yields go down ­accordingly. However, the plants are not physically damaged and some will be available for harvesting. Extreme weather hazards are much more difficult to model. They physically harm plants, and sometimes the entire crop is destroyed. In other cases, some plants recover. Most often, however, they are then affected by secondary pests and diseases. The probabilities of these events are much harder to assess than reduced growth is due to a moderate lack of water.Once again, assessment problems are compounded by the lack of data. Extreme weather only occurs rarely, so the statistical basis is weak. When disasters happen, moreover, people have other priorities than collecting crop data. Even agronomic research stations often discontinue observations after disasters, thereby losing precious reference data.To compute accurate yield functions, moreover, a host of data is relevant. Issues that need to be covered include: – irrigation,– fertilisers,– crop stages,– location as well as– pests and diseases.All information is needed near real-time and has to be calibrated against reference statistics. Once more, satellite observation can help, but only provides ancillary information which is not of much use unless there is sufficient ground data. ConclusionCrop insurance is an important way to protect small farmers from harm. However, the business model is complex. Schemes are only likely to work where there are fully operational meteorological services. At the national level, agricultural extension services are also likely to make a difference. In short, developing countries need comprehensive risk reduction packages. ================ Different kinds of crop insurances The conventional crop insurance schemes that are prevalent in rich nations are called damage-based insurance or multi-peril crop insurance. Basically, a farmer agrees with an insurer that compensation will be given if the farm’s yield or income drops below a certain level. If this happens, the insurer verifies that the farmer’s claim is justified before disbursing any money. This process is labour-intensive and expensive. Therefore, this kind of insurance is more common for high-value crops (like grapes and other fruits) than for field crops (like wheat or potatoes). The main advantage of this kind of insurance is that it can be tailored to indi­vidual needs.Index-based insurance (IBI) is a different model that has recently been used in developing countries. IBI schemes are about insurers paying compensations to clients when an agreed threshold of a specific index is exceeded. The index can relate to wind speed, for instance (hurricane insurance). Other options are minimum and maximum temperatures or levels of rainfall in pre-defined time spans. IBI, however, is only viable where there is a reliable network of meteorological stations. Moreover, there has to be sufficient farm data to estimate risks accurately. Obviously, index definition is crucial to IBI success. The index must relate directly to the insured product. Insurers, therefore, need a precise understanding of what impact a certain kind of event has on the yield of a specific crop. Otherwise, it is impossible to design insurance policies that cover farmers’ actual risks. Any mismatch, however, would either mean excessive premium payments on the side of the farmers or losses on the side of the insurer. Either way, the viability of the scheme would be undermined. The major advantage of IBI is that insurers do not have to check whether clients actually suffer losses, so administration costs are reduced. Accordingly, premiums are lower too. In principle, IBI insurances are more suitable to cover subsistance farmers than conventional crop insurances. Furthermore, complex IBI schemes can involve other economic sectors that are affected by weather – tourism for instance. The more clients an insurance company has, the wider it can spread the risk and the more attractive its policies become.

12.04.2010

Crop Insurance in the USA (2010)

As its proponents hoped, crop insurance has become the largest single source of financial protection to farmers. From insuring 182.2 million acres in 1997, the program has grown to cover more than 264.6 million acres, a slight drop from the 272.7 million acres in crop year 2008. According to National Crop Insurance Services, the program is meeting the Congressional mandate of insuring 80 percent of insurable farmland. There are two kinds of crop insurance: crop-hail, which is provided by the private sector, and multiple peril, an all-risk coverage underwritten by the private sector and the federal government and serviced mostly by the private sector. Crop-hail insures against loss of the value of a crop as a result of damage by hail. Multiple peril insurance covers loss of crop value as a result of all types of natural disasters, including drought, excessive moisture and unusually hot weather. There have been sweeping changes in the federal multiple peril crop insurance program in recent years. Up to 1995, only about one-third of farmers bought federal multiple peril crop insurance because, in the event of a disaster, they could generally rely on Congress to bail them out with disaster assistance and emergency loans. With the passage of reforms in 1995, Congress made it harder to justify legislation granting disaster. It also took other steps to encourage farmers to buy insurance against loss of income due to natural disasters, requiring new types of products, such as revenue protection, to make crop insurance more attractive and subsidizing a portion of the basic traditional coverage that protects against loss of yield. These efforts have paid off. Despite intense hail storms, widespread flooding and large price swings in 2008, there was no need for Congress to enact disaster assistance legislation. RECENT DEVELOPMENTS Premiums and Losses: Total multiple peril crop insurance (MPCI) premiums for crop year 2009 (catastrophic and additional business combined) were a little lower than last year’s total of $9.9 billion. In 2009 MPCI premiums totaled $8.94 billion. The number of acres insured was also lower, dropping from 272 million to 265 million in 2009. In 2008 MPCI premiums were up, due in part to rising commodity prices. Premiums for crop year 2008 increased almost 50 percent over the previous 12 months, according to data from the Federal Crop Insurance Corporation (FCIC), but the industry paid out more than $8.6 billion to farmers due to crop losses and decreases in commodity prices. States with the highest MPCI premium volume in 2009 were Iowa, Kansas, Illinois, North Dakota and Texas. However, only Kansas and Texas reported increases over the previous year. North Dakota saw premiums drop more than 33 percent, the largest percentage decrease of any state, and Nevada, with comparatively low MPCI volume, registered the largest gain. However, in North Dakota, premiums have tended to fluctuate widely, with premiums almost doubling in 2008 from 2007. Premiums for crop/hail coverage also dropped—to $6.2 million, compared with $6.7 million in 2008. States with the highest premium volume were Nebraska, North Dakota, Iowa, Minnesota and Illinois. Among those states only North Dakota and Minnesota gained premium. New Jersey, relatively low on the premium list, reported a gain in crop/hail premiums of 1,348 percent. In 200, New Jersey farmers experienced losses. Claims cost the industry in that state more than $922 for every $100 collected in premium. According to the National Crop Insurance Services, which collects data for the private crop insurance business, 2009, like 2008, was a year of significant crop-hail losses. Historically, the loss ratio has hovered around 67 percent. The loss ratio is the percentage of each premium dollar spent on claims. In the 2009 crop year, preliminary estimates put the loss ratio at about 87, reversing the historical trend. States with loss ratios in excess of 100 in 2009 include Iowa, Kansas, Nebraska and Wisconsin. The crop insurance business is subject to great variability in results, not only by state but across time. For example, the MPCI combined ratio was 90.1 in 2008 but 74.7 the previous year and 124.4 in 2002 when the Midwest suffered a widespread drought. The combined ratio is a measure of profitability; it represents the percentage of the premium dollar spent on claims and expenses. The Standard Reinsurance Agreement (SRA): The 2007 farm bill was finally passed in 2008. Among the major provisions affecting crop insurers was a decrease of $6.9 billion in the federal crop insurance program over ten years, $800 million of which is related to the government’s reimbursement of crop insurers’ administrative and operating costs. Up to now, reimbursements have represented a percentage of premiums, which have risen substantially as crop prices have surged. The farm bill directed the U.S. Department of Agriculture’s Risk Management Agency to renegotiate the agreement for the 2011 crop year. The SRA establishes the financial and oversight arrangements between the industry and the Federal Crop Insurance Corporation. One of the most significant changes will affect crop insurance company agent commissions. A crop insurance company insolvency in 2002 has been attributed in large part to the high commissions the company was paying in Corn Belt states, which far outstripped the reimbursements it was receiving from the federal government. The company had been hoping to make up the shortfall with a superlative underwriting performance. But 2002 was an exceptionally bad year for crops due to a prolonged drought so its financial condition continued to deteriorate. The new agreement limits agents’ commissions to 80 percent of the government reimbursement for administrative and operating expenses, although insurers are allowed to increase this through profit sharing. In addition, the new SRA restructures the expense reimbursement system to neutralize the impact of fluctuations in commodity prices, providing a payment per policy rather than a percentage of premiums. The “Combo” Crop Insurance Policy: The Federal Crop Insurance Program is proposing a new combination crop insurance policy for major grain crops, which will allow farmers to elect either revenue and yield protection.  The ”Combo” policy will replace crop revenue coverage, income protection and several other coverages, the goal being to reduce duplication and paperwork and simplify risk management decisions. There will be one set of policy materials and actuarial documents, one rate setting and pricing methodology, one cost estimator and one database. Originally approved for the 2009 crop year, implementation was delayed by one year to 2010 because of the need to upgrade information technology. New Programs: Livestock insurance is now available in all states where livestock are farmed. Livestock insurance, which just a few years ago was only a pilot project, allows the policyholder to lock in prices for animals to be sold for slaughter. If prices subsequently fall, the policy compensates for a portion of the loss. In a related move that will also help livestock producers, the RMA has developed programs for pasture, rangeland, forage and hay to provide a safety net for farmers who face drought conditions. There are two programs: the Rainfall Index program and the Vegetation Index—both use indexes and grids that are smaller than counties to determine expected losses. The Rainfall program is based on accumulated rainfall and the Vegetation program relies on satellite images to measure departures from expected losses in a given grid area. Originally available on a limited basis, the rainfall index is available in at least 12 states and the vegetation index in at least 6. So far they have been highly successful, with participation levels in excess of expectations. Both programs are available for commercial beehive businesses. Together, these programs ultimately will be available in areas that represent about 25 percent of the nation’s grazing and hay land. The RMA’s long-range goals call for some kind of crop insurance product to be available to cover 98 percent of the value of U.S. commercial crops by crop year 2012. The development of a livestock program will help expand the program since more than half of all farms are livestock farms. In 2004, 15 states deemed historically underserved by the crop insurance program were targeted for $4.5 million in educational programs under the Agricultural Risk Protection Act of 2000. These states are mostly in the Northeast. The northeastern parts of the country have a disproportionate share of small farms. This program is continuing along with an outreach program to specialty crop producers, few of whom are insured, and ranchers. One answer to the problems of small farms may be what has become known as an adjusted gross revenue “lite” insurance program which covers the whole farm under one policy. The policy provides a maximum protection of $100,000 and can cover all crops and animal production including milk. Approved as a pilot program in some parts of Pennsylvania in 2003, it was expanded to cover five more states for the 2005 crop year. The program is now available in more than 30 states. CROP INSURANCE, 1999-2008 ($000) Year Direct premiums written (1) Annual percent change Loss ratio (2) Annual point change 1999 $508,108 -11.9% 76 -7 pts. 2000 468,405 -7.8 68 -8 2001 433,743 -7.4 69 1 2002 405,003 -6.6 70 1 2003 422,137 4.2 56 -14 2004 427,567 1.3 58 2 2005 434,711 1.7 44 -14 2006 405,254 -6.8 50 4 2007 489,649 20.8 48 -2 2008 669,436 36.7 83 35 (1) Before reinsurance transactions, total for all policyholders of crop-hail insurance.(2) The percentage of each premium dollar spent on claims and associated costs. A drop in the loss ratio represents an improvement; an increase represents a deterioration. Source: National Crop Insurance Services. MULTIPLE PERIL CROP INSURANCE, 1999-2008 ($000) Year Net premiums written (1) Annual percent change Combined ratio (2) Annual point change (3) 1999 $725,821 1.8% 98.2 NA 2000 938,840 29.3 90.4 -7.8 pts. 2001 1,321,820 40.8 96.0 5.6 2002 2,003,443 51.6 124.4 28.4 2003 1,702,862 -15.0 109.8 -14.6 2004 2,203,143 29.4 76.1 -33.8 2005 2,234,630 1.4 91.3 15.2 2006 2,828,084 26.6 77.8 -13.5 2007 3,648,996 29.0 74.7 -3.0 2008 5,077,625 39.2 90.1 15.3 (1) After reinsurance transactions, excluding state funds.(2) After dividends to policyholders. A drop in the combined ratio represents an improvement; an increase represents a deterioration.(3) Calculated from unrounded data. NA=Data not available. Source: National Association of Insurance Commissioners (NAIC) Annual Statement Database, via Highline Data, LLC. Copyrighted information. No portion of this work may be copied or redistributed without the express written permission of Highline Data, LLC. BACKGROUND Insurance works best when everyone exposed to a certain kind of risk, such as fire, buys a policy, but only a limited number of policyholders suffer losses (and therefore file claims) in any given year. Where all policyholders in a geographical area are likely to file claims, as farmers would in the event of a drought, and where the people mostly likely to purchase insurance are those most vulnerable to loss, such as farmers in flood plains, insurers cannot spread the risk of loss broadly enough and over a sufficient length of time to make insurance affordable. This fundamental principle of insurance is critical to an understanding of the history of crop insurance. Agricultural production is subject to many uncertainties, including natural disasters. Adverse weather, insect infestations and plant diseases can severely reduce the yield or quality of a crop, wiping out a farmer's profits for the whole year in a bad season. The most important consideration, as far as insurers are concerned, is the potential for catastrophic losses resulting in widespread and severe damage claims. Many "perils," or causes of loss, to which farmers are exposed, such as heat and drought, freezing temperatures and excessive moisture, can affect whole regions. Droughts may also persist for extended periods so that farmers may suffer successive losses.   But there is one common weather-related disaster that generally impacts a more limited area, and that is hail. Hail strikes randomly and erratically. Crops growing in one part of a field may be completely ruined while the remainder is unscathed. In addition, damage from hail can be easily identified and assessed separately from other adverse conditions that can lead to yield losses. The catastrophic nature of many crop-related perils led to the development of two types of crop insurance: crop-hail insurance, which is provided by the private marketplace, and the multiple peril crop insurance program, which is overseen and subsidized by the federal government and sold and serviced by private insurers. Multiple peril insurance covers most causes of loss, as its name suggests. The History of the Federal Crop Insurance Program: Hail insurance has been in existence in some form since the early part of the twentieth century and it has been a thriving segment of the insurance industry since the 1920s. Insurers also tried to develop a multirisk crop insurance business. But the attempt failed because they had insufficient data to set adequate rates to cover the kind of widespread catastrophic losses that long periods of drought, for example, produced. In 1933 at the height of the Great Depression, Congress passed major legislation aimed at protecting the family farm. By restricting domestic production, it hoped to raise prices for agricultural products and this, together with subsidies to keep acreage unplanted, would restore farmers' standard of living to pre-World War I levels. Five years later in 1938 after the U.S. Supreme Court declared the law unconstitutional, a new piece of legislation was enacted with similar goals, authorizing the Secretary of Agriculture to set acreage and marketing quotas for staple and export crops and to pay cash subsidies for planting soil conserving crops. (It was not until the 1990s that Congress began to seriously question the wisdom of protecting farmers from market forces, especially since the family farms that such programs were designed to protect now account for only a small portion of agricultural production.) In the same year that price support legislation was passed, Congress approved the Federal Crop Insurance Act, thereby creating the first federal crop insurance program. Backed by the resources of the U.S. Treasury Department, lawmakers expected the federal program to avoid the problems that had thwarted the formation of a private multirisk insurance industry. However, it was plagued by high costs, low participation on the part of farmers and an inability to accumulate sufficient reserves to pay for catastrophic losses.  And as federal expenditures under these programs grew, not surprisingly, farmers had little incentive to purchase crop insurance and consequently for decades the program remained limited in scope. In 1980, frustrated by the program's continuing deficiencies, Congress passed legislation designed to make crop insurance the preeminent vehicle for helping farmers survive major agricultural disasters. Its goals were to increase participation in the program to the point where government-funded disaster assistance programs could be abolished; raise the level of efficiency by joining with the private sector to sell, service and bear some of the risk of providing coverage (until then crop insurance was provided solely by the U.S. Department of Agriculture); and create an actuarially sound program that would reduce federal outlays while keeping coverage affordable through subsidies. The private sector would be involved in two ways: as master marketers and reinsured companies. Master marketers were insurers paid by the federal government to sell crop insurance policies but who did not assume liability on policies they serviced. (This arrangement was phased out by 1994, see below).  A decade later the program was still experiencing problems. Market-oriented Reforms: The Federal Crop Insurance Reform Act of 1994 was passed at a time when the costs of all agricultural programs were under intense scrutiny as part of efforts to balance the federal budget. With little hope of bringing expenditures under control unless it made sweeping changes in the program, Congress decided to mesh crop insurance and disaster assistance into one program, radically restructuring the agricultural community's safety net. Lawmakers took a multipronged approach. First, if disaster payments were to be severely curtailed or abolished, farmers would need some measure of economic security. A key element of the legislation, therefore, was the provision of basically free "CAT" coverage—insurance against catastrophic losses. All producers of insurable crops would be able to purchase CAT coverage for a nominal processing fee. Crops not covered by the federal crop insurance program would be eligible for a special disaster assistance program with payments triggered by area-wide losses. The level of payment would be similar to that of the CAT insurance plan. Second, as an added incentive for growers to invest in a comprehensive multiple peril crop insurance program, the federal government would subsidize the premium for additional insurance coverage, see below. Third, the "emergency" designation status for crop loss legislation, which allowed undisciplined off-budget borrowing to pay for disaster relief, would be repealed. Any future disaster assistance would be considered part of the budget and therefore could not be approved without an offsetting reduction in spending for other programs. Fourth, all farm programs, including crop insurance, would be handled by a single agency to improve service and program coordination. The Federal Crop Insurance Corporation would manage the crop insurance program, establishing insurance policy terms and conditions, setting rates and generating the payment of claims through its Risk Management Agency (RMA). The exception to this is the noninsured crop disaster assistance program, which remains with the Farm Service Agency.  The sale and servicing of policies would be shifted to the private sector. The New Deal price support program had allowed farmers to sell their crops to the federal government for a fixed price when market prices fell below a government-set target price. Now that the subsidy program was about to end, there was a need to fill this gap. The 1996 Agricultural Market Transition Act addressed the need for "revenue" protection—the product of yield and price. Provisions in the bill set up various pilot programs that respond to fluctuating price levels as well as yield variability using the  Chicago Board of Trade (CBOT) commodity prices. In addition, the CBOT itself has developed a new crop yield insurance product that allows grain elevators to offer farmers over-the-counter revenue insurance contracts in much the same way as they now offer cash-forward contracts. The major difference between CBOT and insurance products is in the underlying standard on which the contract is based. Insurance products are tailored to an individual farmer's historic yield, or in some cases to the yield of the county, see Revenue Insurance section, whereas the CBOT contracts are based on much broader aggregates, such as the state average yield. In 2000, Congress approved another major piece of legislation, the Agricultural Risk Protection Act (ARPA).  The Act made it easier for farmers to buy different types of multiple peril crop insurance, including revenue insurance, by increasing government subsidies. The measure also addressed the problem of farmers who face lower than average yields in their production history following multiple years of natural disasters. A succession of bad harvests lowers farmers’ insurance payments since compensation for low yields is based on actual production history. Under the law, farmers may include a yield equal to 60 percent of the long-term county average for any year in which their yield falls below that amount. In addition, the legislation focused on eliminating waste, fraud and abuses of the program; expanded pilot programs to include coverage for livestock; and extended risk management activities to underserved areas. Farmers with a good record may receive a performance-based discount on premiums. Crop-hail Insurance: Insurance coverage for hail damage is provided by both the private sector, with crop-hail insurance, and under federally subsidized multiple peril insurance policies. Farmers who purchase crop-hail coverage can choose to drop coverage for hail under the multiple peril policy, in exchange for a reduction in premium, or keep it for additional protection. A basic crop-hail policy covers losses due to hail and generally also fire, which is characterized by the same randomness as hail. The policy also covers damage caused by lightning and transit after harvest to storage. Coverage for additional causes of loss, such as vandalism, may be available as well as coverage for replanting costs when hailstorms early in the growing season damage a crop so severely that it has to be replanted. When the destroyed crop is replanted, the farmer also receives compensation for the reduction in expected yield due to the later planting date. Most insurers offer policies for the major grain and hay crops but the availability of coverage for specialty and vegetable crops is more limited. A policy can be purchased at any stage during the growing season from the time when 50 percent of the crop is clearly visible to the anticipated harvest date, as long as the crop has not already been damaged by hail. To prevent growers from closely tracking weather patterns and waiting until a storm with the potential for hail is imminent before buying insurance, the policy does not take effect until one minute after midnight on the second day after the signing of the application. Farmers can insure all crops in which they have a financial interest (where land is leased, the landowner as well as the farmer have financial interests in the crop yield) or just a portion of their acreage. The amount of coverage, which is purchased on a per-acre basis, is limited to the expected value of the crop, including anticipated profit. Coverage amount is the harvest price per bushel (or pound) forecast for the crop at the time the insurance policy is sold, times the number of bushels or pounds each acre is expected to produce. Premiums vary according to the susceptibility of the crop to hail damage and the location of the crop. Since hail losses have been tracked for more than 40 years, certain townships are known to be more prone to hail damage than others. After a report of loss, the adjuster estimates the percentage reduction in yield due to hail damage by taking samples and sometimes actually counting the plants damaged in a representative area. The loss calculation takes into account the fact that the expected value of the crop at the time the loss occurs may be higher than the value (yield times market price) forecast at the time the policy was written. However, the claim payment or "cash value" cannot exceed the original underwriting limit or the policyholder's financial interest in the crop. Where there is the possibility of a bumper crop, the farmer may increase coverage mid-season. Multiple Peril Crop Insurance: Multiple peril, or all risk crop insurance, protects against low yield and crop quality losses due to adverse weather (including hail) and unavoidable damage from insects and disease. While multiple peril insurance covers most economically significant agricultural crops grown in the United States—more than 100 crops—insurance for a specific crop may not be available in every state or in every county within a state. Most crops for which there is not yet coverage are eligible for the limited protection offered by the Noninsured Crop Disaster Assistance Program. A farmer purchasing multiple peril crop insurance has a number of coverage options. The first is a CAT (catastrophe) policy, the lowest amount of protection available. This coverage, which pays 55 percent of a crop's established price on crop losses in excess of 50 percent, provides a basic safety net. To encourage proper record keeping, reduce overpayments and deter fraud, payments may be reduced by up to 50 percent where farmers lack certified historical yield records, known as actual production history (APH). The federal government subsidizes the entire cost of the CAT coverage. Farmers pay only an administrative fee. In addition, farmers can buy additional insurance, known as "private supplemental," under a "buy up" program designed to encourage purchase of higher, more adequate levels of coverage. Under the buy-up program, the federal government subsidizes a portion of the premium. Currently, the subsidy decreases as the amount of coverage rises. However, while the government’s share of the premium shrinks with each step up in coverage, the total dollar amount that the farmer receives in subsidy increases. In addition, there are more complex supplemental coverages that protect farmers who, for example, commit their entire crop to food processing plants in advance of harvest or need it to feed livestock and therefore must be able to replace lost crops at market prices. There are also supplemental programs to increase the loss payment amount and to increase payments in catastrophic situations. Producers of some crops may be eligible for a multiple peril coverage known as "group risk" crop insurance, which may cost less than other options. It differs from the basic coverage in that yield guarantees are based on the county average yield rather than that of the individual farmer and is suitable for farmers whose yields tends to follow countywide yields. Policyholders automatically receive an insurance payment in any year that the county average yield falls below the yield guarantee. Group risk income protection adds a price protection feature to this coverage. Differences Between Crop-hail and Multiple Peril Insurance: There are several key differences between multiple peril and crop-hail insurance programs. First, farmers purchasing multiple peril insurance choose coverage levels by "unit" rather than by acre as with crop-hail. A unit is the entire acreage of the crop planted in the county by the farmer. Farmers can also break down coverage by "sections"—one square mile—or by irrigated and dryland practices. This difference is most evident when a loss occurs, because in the multiple peril program the amount of the loss—the reduced yield—is averaged out over all the fields in the unit rather than over the affected acre or acres insured. Second, a farmer cannot suddenly decide to buy a multiple peril policy. Unlike crop-hail, multiple peril coverage must be purchased prior to certain dates set by the federal government, which vary according to the county and the crop. These sign-up deadlines are set early in the planting season before long-range weather forecasts can influence purchase decisions. Coverage takes effect once the crop is planted, but the crop must be planted before the last government established planting date by crop and by county. Coverage may not be added during the growing season. In addition, crop-hail coverage generally provides coverage from the first dollar of loss, although deductibles are offered, whereas multiple peril coverage includes what amounts to a deductible, guaranteeing up to 100 percent of expected market price but never 100 percent of yield. Standard Reinsurance Agreement: From a private reinsured company financial perspective, the federal crop insurance program is unique in many ways. The first is the Standard Reinsurance Agreement. This sets out the relationship between private insurance companies and the federal government concerning the risk each will bear. There are three risk pools in each state—the commercial, developmental and assigned risk funds—and the amount of risk the insurer retains varies according to the pool and by state. Those policies covering acreage in counties known for low yields, for example, will be placed in the assigned risk fund, where the federal government bears most of the risk, and those where the risk of low yields is lowest in the commercial pool. Insurers may also reinsure a portion of their business in the private reinsurance market. Second, the agreement reimburses crop insurers for administrative and operating costs. Starting in crop year 2011, all administrative and operating costs will be reimbursed by the federal government on a per policy basis rather than a percentage of premiums basis to neutralize the impact of fluctuations in commodity prices.   In addition, crop insurers have less investment income than insurers in other segments of the industry because they receive payment for coverage after it has been provided, rather than in advance as with other types of insurance. Premiums, for example, are not due until the end of the insurance period and are not paid on policies under which claims have been filed.  The premium is deducted from amounts owed, and administrative expenses are not reimbursed until the actual acreage planted is reported, often as much as five months after the insurance sales closing date. Moreover, premiums fluctuate widely because they are tied to the market value of the crop and the acreage planted. Revenue Insurance: Farmers face three major risks: low crop prices, poor quality and low yields. Under the standard multiple peril policy, farmers are compensated for losses in crop yield. The market price paid for each bushel is fixed at a level set by the government in advance of the growing season, regardless of the actual price at harvest time, which could be lower or higher than the government forecast. The policy is triggered when the yield is less than the level of protection selected. Coverage can be between 50 and 75 percent of what their acreage typically produces and from 60 percent to 100 percent of the projected market price. The uninsured portion of the yield and anything below the full market price is essentially a deductible. Revenue insurance, which was first introduced in the mid-1990s, goes a step beyond standard multiple peril coverage. It guarantees farmers a certain income, allowing them to manage both yield and price risk. It recognizes that farmers’ income is the product of the price they receive for what they have grown, as well as the number of bushels or pounds their acreage yields. With a revenue insurance policy in hand, farmers can borrow against and market their crops in advance, knowing they will have set revenues regardless of market conditions at harvest time. Several broad types of revenue insurance programs have been developed.  These include Income Protection (IP) under which the farmer receives a payment when any combination of low harvest prices and low yield push gross income below the guaranteed income level selected and Revenue Assurance which is similar to IP in most respects except that commodity prices are adjusted to reflect average prices in the county to make them more representative of local market conditions.   There is also Crop Revenue Coverage which provides more comprehensive protection than the other two programs in that its revenue guarantee, which is based on the higher of two prices: the early market price and the harvest market price, covers fluctuations in market price both up and down. Revenue coverage is also available based on the county average revenue rather than the historical average of the individual farmer.  Another option, particularly for small farms, is adjusted gross revenue coverage which insures the revenue of the entire farm, including some livestock rather than a single crop. Insurance Information Institute

1
of 4
istanbul escort şişli escort tbilisi escort şişli escort şişli escort maslak escort istanbul escort beşiktaş escort taksim escort izmir escort ümraniye escort mecidiyeköy escort şişli escort taksim escort ümraniye escort kartal escort şirinevler escort maltepe escort istanbul escort ümraniye escort kadıköy escort vip escort mersin escort istanbul escorts ataköy escort avcılar escort beylikdüzü escort okmeydanı escort şişli escort tuzla escort işitme cihazı sex shop sex shop sex shop sex shop sex shop sex shop sex shop sex shop