Extreme Weather Events Cause Crop Loss in Iowa
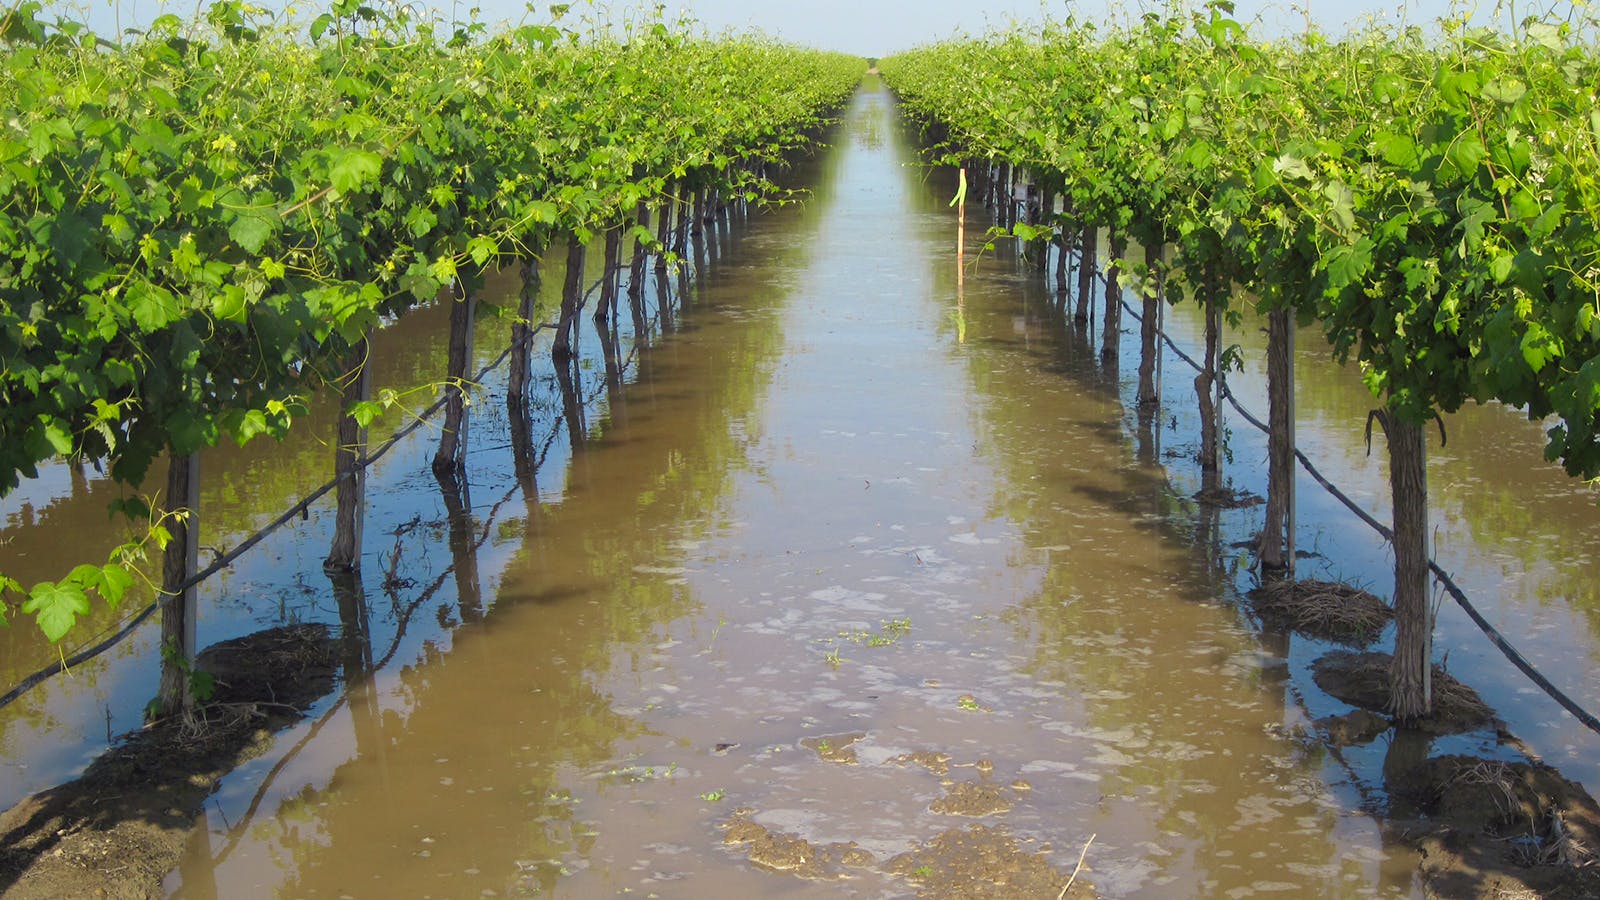
In the U.S. Midwest large rain events are common in the summer, saturating the ground which then floods. Drainage is important in Iowa but it is often not sufficient for larger rain storms. Last summer Iowa farms received record rainfall, having several seven-inch rain storms in a row. Given this large amount of water with no place to go, crops inevitably drown because of lack of oxygen to the roots and sun to their leaves.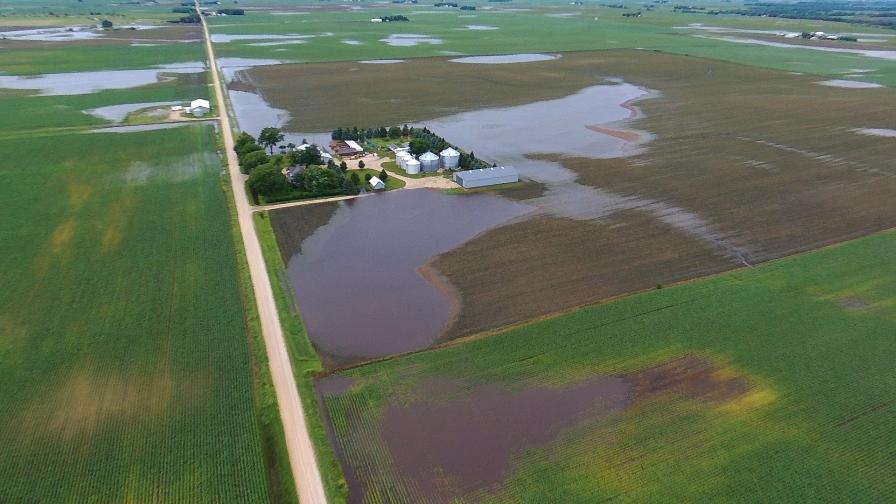
Drone flight over flooded fields in Iowa.
Assessing Flood Damage With the USDA RMA
In the U.S. the insurance industry provides policies backed by the U.S. government and an agency called the USDA Risk Management Agency (RMA). These policies (sold by insurance agents) insure farmers crops to a certain value of production. When large damaging storms occur, farmers (policyholders) need to file a written notice of damage within a time period (usually 72 hours from the initial discovery) to be eligible for coverage. The written notice of damage or loss initiates a claim procedure and if necessary a third party insurance loss adjuster will come to the farm and inspect the loss, record measurements and submit a claim.¹ This is what ultimately decides if the farmer gets paid or not based on their insurable level. Usually when a farmer receives a record rainfall in a short period causing a flood, they will contact their agent and start a claim. The agent will file the claim and assign a loss adjuster who then makes an appointment for an on-site visit.Digital Representation of Flood Aftermath
Once on-site the loss adjuster will fly a drone over the damaged areas and collect the data. In addition to a drone, the loss adjuster can also use drone mapping software to process and visualize the data in order to measure the crop loss. These measurement methods fall into the USDA RMA approved measurement methods.² The loss adjuster will create a set of visuals based on which they can then assess the damage and create a PDF report for the farmer with the findings. With the field boundary feature, the loss adjuster can trim the field to the exact size, to make the assessment even easier. In the image below (generated by the collected data from one of the flooded fields in Iowa) the soil moisture is easy to detect.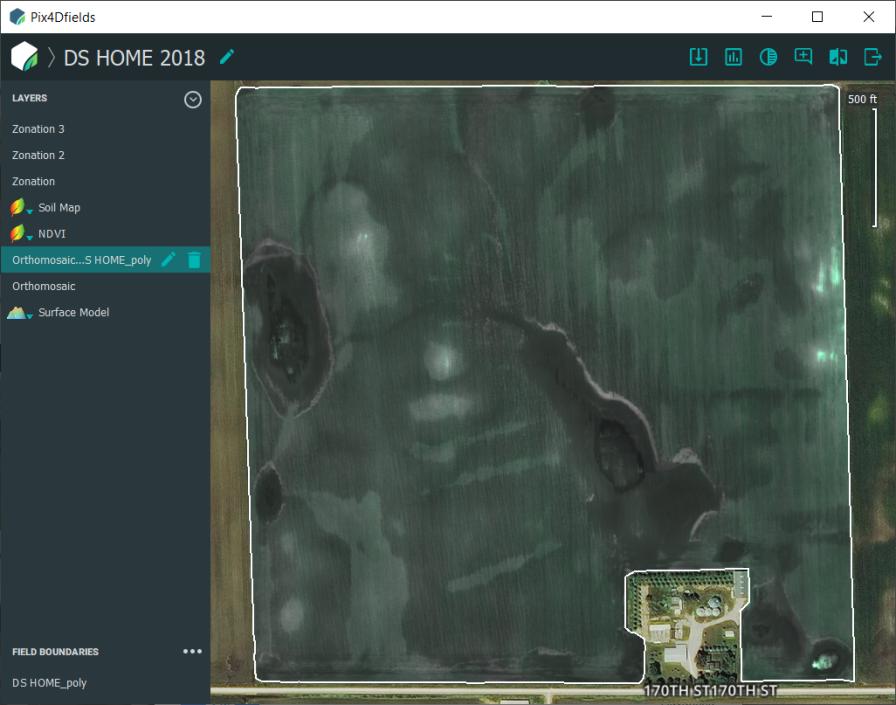
Orthomosaic of soybean fields processed in Pix4Dfields. The more saturated soil is darker than the surrounding areas.
Custom Indices for Custom Results
The next stage is estimating the level of damage and area. To do so the loss adjuster can create a custom index. Because NDVI is good at detecting vegetation, it is also very good at finding bare soil which is typically lower than 0.3. By using the custom index formula: (nir-red)/(nir+red) + 0/min(0; (nir-red)/(nir+red) – 0.25), the software can mask all the vegetation pixels except the ones showing the bare soil which in this case represent damaged areas.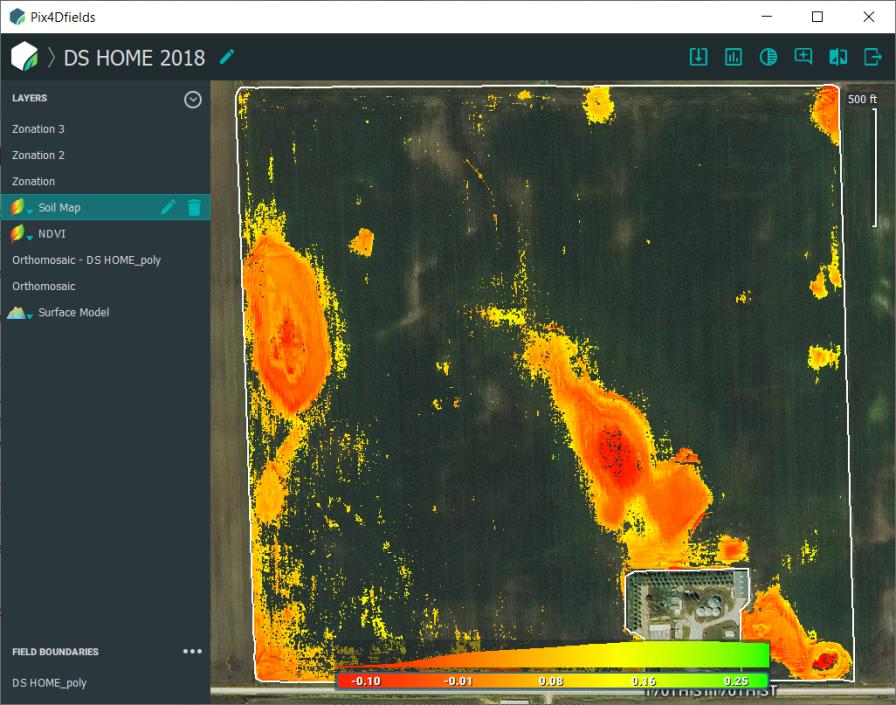
Custom index created using index calculator in Pix4Dfields.
Quantifying the Damage Severity
Later on, by using the zonation tool the loss adjuster can quantify the results into acres and severity of damage. Each zone will have an associated level of loss category (for example, 100% damage for the orange zone on 8.5 acres and 85% damage for the lighter orange zone on the 10.9 acres).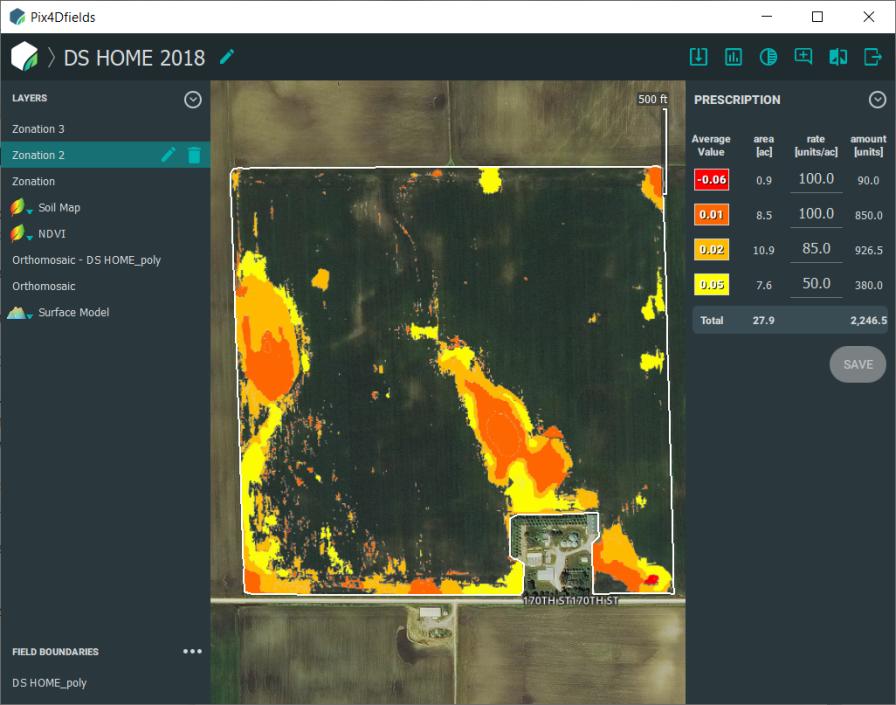
Creating zones of damage severity.
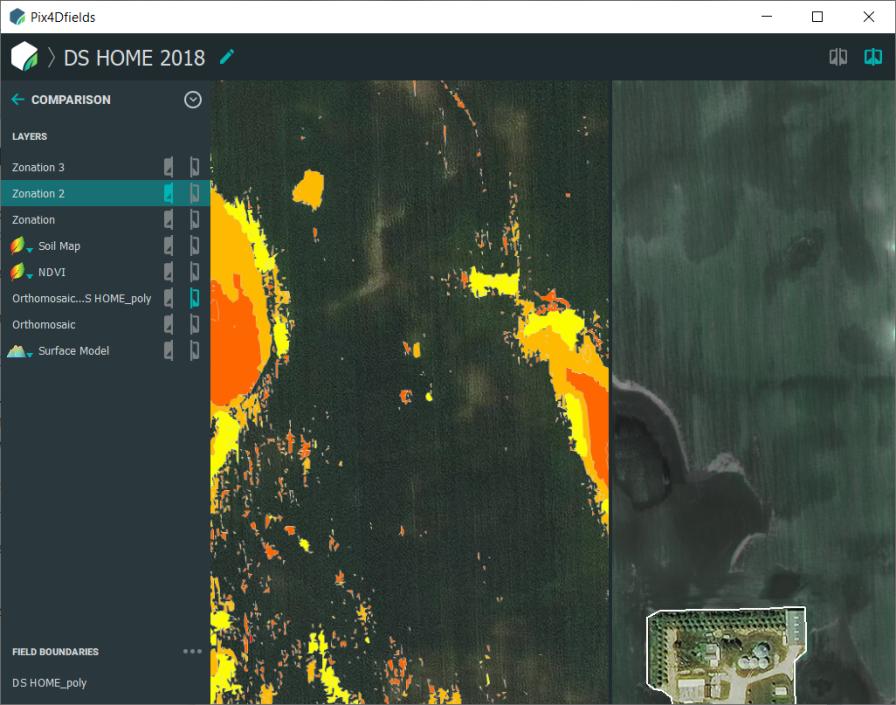
Comparing the custom index soil map and orthomosaic.
Inspecting the Flood-Damaged Field and Reporting
Zonation outputs can also show the rings of varied damage intensity. This can be used as an indicator for the loss adjuster of where to go in the field to inspect the damage level. Once in the field, the loss adjuster can take ground images and annotate them for the purpose of extra information and context.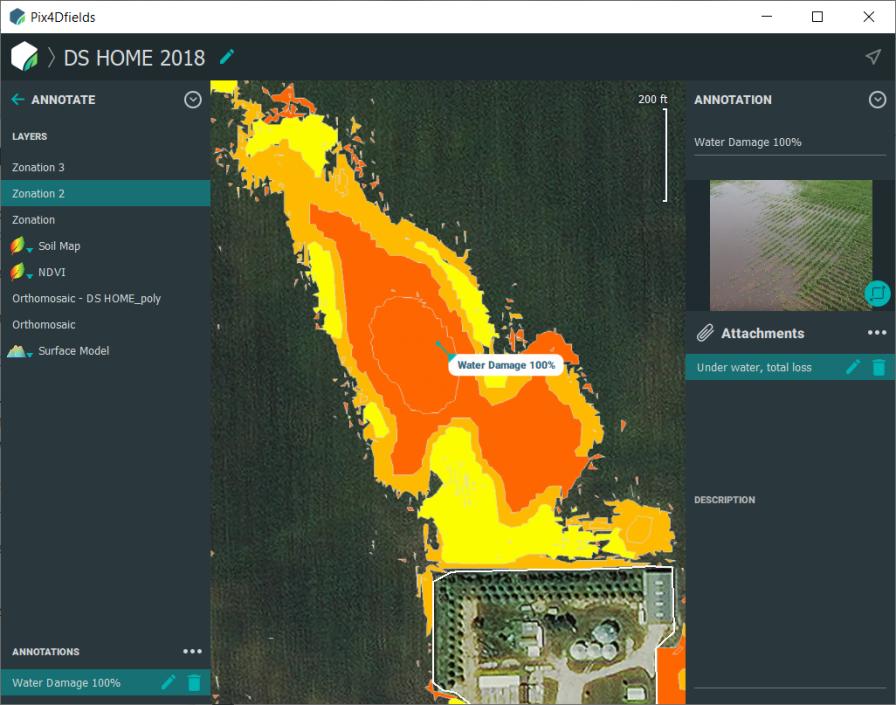
Annotation tool with attached images from the field.