
Since the inception of the modern crop insurance performance program, Illinois and the Midwest have had relatively low loss ratios compared to other areas of the country. This result holds even including the 2012 drought year in a relatively short history. Low loss rates in the Midwest and higher loss rates in other regions combine such that overall U.S. loss ratios are near 1.0. Still, disparities mean that farmers in the Midwest pay too much for crop insurance, while farmers in other regions pay too little.
Judging Crop Insurance Performance
Loss ratios are used to judge crop insurance performance. The loss ratio is defined as the total insurance payments divided by the total premiums paid. Total premiums include those paid by farmers and the risk support provided by the Federal government. A loss ratio of 1.0 means that crop insurance payments equal the total premium. Loss ratios above 1.0 mean that payments exceed premiums and vice versa.
The Risk Management Agency (RMA) has a legislative mandate to maintain an actuarially sound crop insurance program plus a reasonable reserve, meaning that loss ratios should average slightly below 1.0 over time. The program operates on a loss-cost ratemaking basis with the intent to increase premium rates for high loss areas and crops, and to lower rates for low loss areas and crops. By design, rate changes occur slowly. RMA also periodically undertakes more comprehensive rating reviews to adjust ratings to move toward specific policy goals.
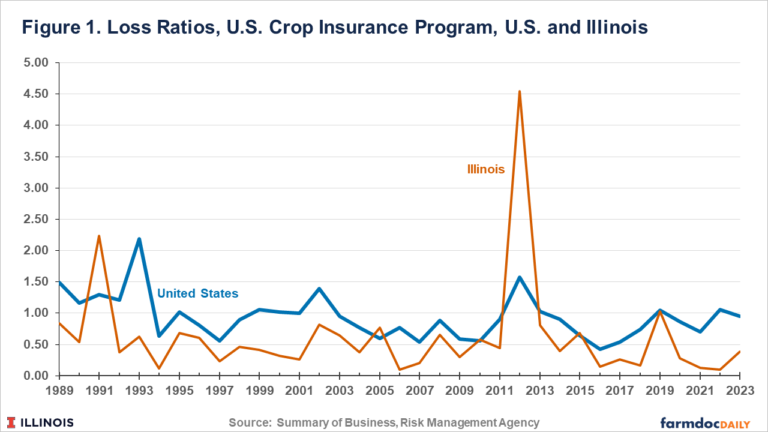
RMA provides crop insurance performance data in its Summary of Business, which is publicly available in electronic form from the 1989 to current years. Figure 1 shows the average U.S. loss ratio. Loss ratios have averaged:
- .96 from 1989 to 2023, the entire loss history in the Summary of Business
- .93 from 2004 to 2023, the last twenty years.
- .80 from 2014 to 2023, the last ten years
The overall program has had loss ratios that are somewhat below 1.0 and appear to be declining through time. Still, regions across the US have had different experiences.
Illinois versus U.S. Performance
The overall loss ratio for Illinois was .39 in 2023, continuing a string of very low-loss ratios since 2019. The Illinois loss ratio was .28 in 2020, .13 in 2021, and .10 in 2022. Compared to the U.S., the performance of Illinois over various periods has been:
- From 1989 to 2023, the loss ratio for Illinois averaged .62 compared to .94 for the U.S. The difference in loss ratios is .32 (.94 U.S. minus .62 Illinois)
- For the last twenty years, from 2004 to 2023, the loss ratio for Illinois was .62 compared to .81 for the U.S. The difference in loss ratios is .19, even including the 2012 drought year.
- For the last ten years, from 2014 to 2023, the Illinois loss ratio averaged .40, below the U.S. loss ratio of .80. The difference in loss ratios was .40.
If anything, the difference in loss ratios is becoming wider, as the .40 difference for the last ten years is larger than either the .19 average for 20-year from 2003 to 2024, or the .32 average from 1989 to 2023.
Since 1989, the loss ratio in Illinois has been below the U.S. loss ratio in all but five years: 1991, 2005, 2010, 2012, and 2015 (see Figure 1). The largest difference occurred in 2012, the drought year in the Midwest when the loss ratio for Illinois was 4.55 versus the U.S. loss ratio of 1.57.
Drought years of the magnitude of 2012 rarely occur, presenting a problem in evaluating loss performance. The 2012 drought greatly impacted Illinois’ 20-year loss ratio from 2004 to 2023. However, even including the 2012 drought, the loss ratio for Illinois was .62, still below the average for the US. Even if a drought like 2012 occurs in 1 in 20 years, or 5 percent of the time, inclusion of the 2012 drought year will tend to overstate the average loss ratio in areas impacted by the drought moving forward given the sample length used.
To evaluate the probability of a 2012 event, differences of annual yields from trend for Illinois corn yields as reported by the National Agricultural Statistical Service (NASS) were calculated and used to compare frequency of lower and higher yield outcomes. Corn yields were selected for this analysis, as corn is the largest contributor to yearly crop insurance losses in Illinois. NASS reports yields from 1866 to the present, and we calculated an annual trend yield based on the previous 30 years of yields. Then, we calculated yearly deviations from the trend yield, as shown in Figure 2.
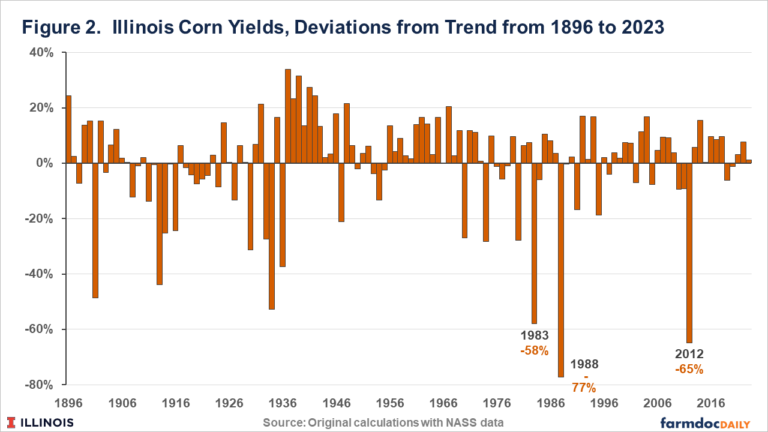
In 2012, the actual yield was below the trend yield by 65%. Actual corn yields were below trend by more than 65% in only one other year: 1988, another severe drought year. Between 1866 and 2023, there were four years in which yields were 50% below trend, indicating that a 50% yield decline is about 1 in 32-year event. Thus, history suggests that events like 2012 occur less frequently than 1 in 20 years, with a more likely frequency of 1 in 32 years. Thus, the weighting in the average from 1989 to 2023 — 35 years — likely is about right. Again, since 1989, the loss ratio for Illinois has been 0.32 lower than the total U.S. average.
Why Does it Matter?
If Illinois has a loss ratio below the U.S. average, other regions must have higher loss ratios above the average. As has been demonstrated by several research efforts, loss ratios do exhibit a geographical pattern. Figure 3 shows average loss ratios by county across the U.S. for the last ten years. Illinois has low-loss ratios, as does much of the Corn Belt. Low-loss ratios extend from the eastern half of North and South Dakota, Nebraska, and Kansas through Minnesota, Iowa, and Missouri, continuing into Wisconsin, Illinois, and Indiana, and ending in Michigan and Ohio. High loss ratios occur over many regions but are predominant in the southern tier of states, beginning in California, Arizona, New Mexico, Texas, Oklahoma, Arkansas, Louisiana, Mississippi, Florida, Georgia, South Carolina, and North Carolina. Counties in the Northwest (Washington, Oregon, Idaho) and Northeast (New York) also have high-loss ratios.
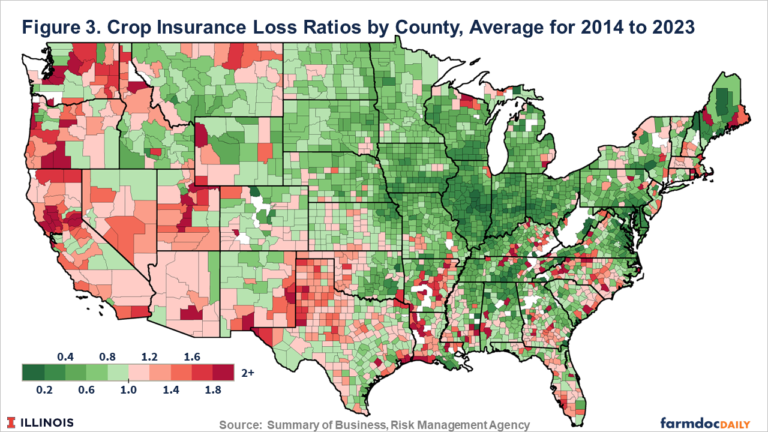
Overall, differences in loss ratios result because premiums have exceeded indemnity payments in areas of low-loss ratios, and vice versa. The Corn Belt generally has premiums that have exceeded losses in the region. If premium rates more accurately reflected losses, Midwest farmers would pay less, while other areas would pay higher premiums. So doing would better reflect the actual risk of growing and insuring crops. Arguably, keeping premiums too low in areas of high risk presents the potential for encouraging production in those areas at the expense of other areas. While support to continue production in higher risk areas may be a policy objective, crop insurance may not be the ideal vehicle given the requirements to develop programs and policies that include actuarial soundness requirements.
Current Farm Bill proposals include increasing subsidies on county-level products such as the Supplemental Coverage Option. Such changes would further exacerbate this issue and increase insurance subsidies most for the highest risk areas, shifting additional costs to taxpayers and producers in other areas. Those proposed program changes would alter crop insurance making it more like an income transfer than a safety net program. Focusing on improving premium rate accuracy in all areas becomes more critical for fairness and program integrity in the long run.
Summary
Illinois and the Midwest have low loss ratios relative to the U.S. and other regions of the country. As a result, Illinois and Midwest farmers have historically paid relatively higher premiums relative to crop losses than other areas of the country. Efforts to improve crop insurance should be made to further align crop insurance premiums with losses.
Source - https://farmdocdaily.illinois.edu